The 2018 Amazon Sales Estimate Accuracy Case Study
Read the 2019 update HERE!

By Greg Mercer, CEO and Founder of Jungle Scout
At Jungle Scout, we’ve put a tremendous amount of time and money into the accuracy of our sales estimates over the past year. We're aware of the concerns in the Amazon FBA community debating the accuracy of sales estimates across the various tools in our competitive landscape. A question we often hear is, “Is Jungle Scout the most accurate when it comes to estimating the number of sales on an Amazon listing?”
Well, I’ve always assumed we are the best since we have the most data, the biggest and most experienced team, we were the first in the industry, and in general, we just care the most about the integrity and accuracy of our data.
But, an assumption isn’t worth squat, so I figured it was time to actually test this for ourselves. The truth is, trying to estimate Amazon sales is complex, and no one has ever done a legitimate case study on the range of tools available.
As most of our readers know, Jungle Scout is a very transparent company. We publicly and transparently launch Amazon products, we share the inner workings of our company, and we host weekly AMA’s to answer anything else about Amazon or our company that our audience can’t find through a Google search.
In the same spirit of transparency, I wanted the world to be able to see every working detail of our Sales Estimate Accuracy Case Study. I knew from the get-go, if we were the most accurate, everyone would probably just think the case study was biased with a bunch of made up numbers (I would too if I was reading this on someone else's site).
So - how could we create a transparent, bulletproof, cannot-be-argued, couldn’t-have-been-fudged, university-white-paper-quality, accuracy case study?
This is what we came up with:
The Data Collection Plan
- Ask as many sellers as possible to allow us access to the business reports section of their Amazon Seller Central account.
- Find these sellers in an unbiased way. We wanted sellers of all sizes, selling different stuff to represent all Amazon sellers. So we used paid Google and Facebook ads, posted in Facebook communities, on the Amazon Seller Central forum (which then got deleted for breaking their TOS, oops!) and emailed our list.
- Hire a third party to collect the data from each tool while recording their screen to capture the entire data collection process.
- The third party would then go to the seller’s business reports in Seller Central and record the actual sales for the past 30 days.
- Immediately after that, run Jungle Scout and each of our competitor's tools, one after the other so that they were all run within the same time period.
- Record the actual sales and all the estimated sales from Jungle Scout and all the competition in a Google sheet.
- Publicly post the raw data for everyone to run their own analysis on.
- Publicly display the unedited screen recordings so everyone can verify the accuracy of the raw information for themselves.
Case Study Methodology
We ended up getting 50 sellers to opt-in to the case study. We were hoping for over 100, but it turns out people don’t exactly love the idea of sharing their business metrics with the world.
From these participants, we had access to the real sales data for over 1000 ASINs.
After that, we had to do a little data cleaning, as explained below:
- The ASIN needed to control the Amazon Buy Box at least 99% of the time.
⁃ All of the tools work to show the unit sales on the listing, not the unit sales of an individual seller, so we needed sellers who controlled the Buy Box the entire month. 99% seemed close enough (probably lost a sale or two to hijackers) and so we deemed that as the minimum.
⁃ The Buy Box refers to the box on a product page where customers add the item to their cart or make a "Buy Now" purchase.
- We scrubbed the non-numeric data and provided an assumed sales value that would allow us to compare the estimate results. For ASINs that returned <5 sales estimates for the previous month, we assumed a sales value of 4.
- Finally, additional data cleaning filtered out child product ASINs that shared rank with other child products. This is the case in a few weird categories on Amazon. As a result, the tools can only estimate sales for the all the child products combined (not each individual one), so these actual sales didn’t do us much good.
The Data
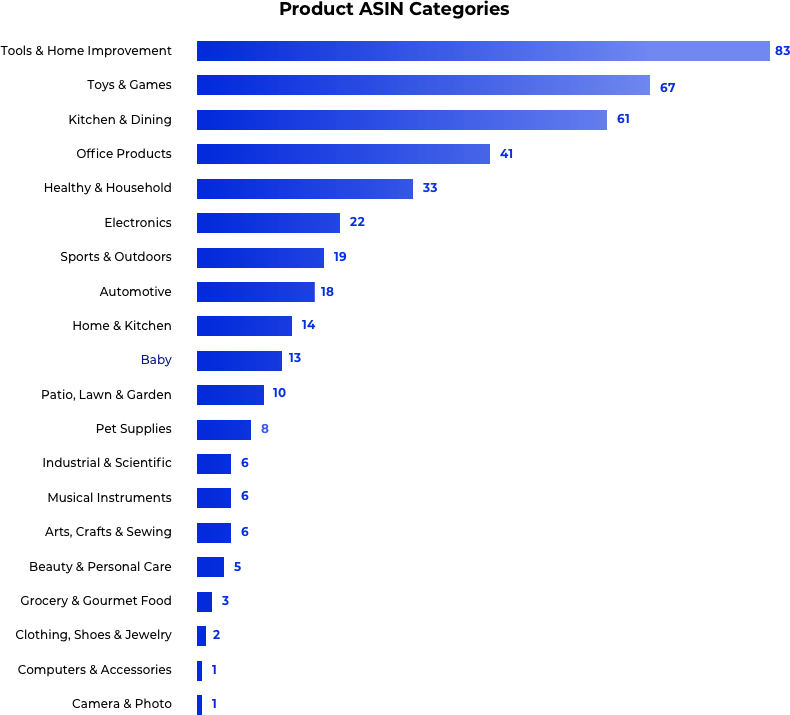
After applying these filters to remove poor quality data, we were left with 454 ASINs to be tested. They were spread across the following Amazon product categories.
In a perfect world, each category would be represented equally, and we could have data from all the product categories. But, we were pretty happy to have user-submitted data for almost all of the categories.
Here’s the spread:
The Analysis & Results
What is the best way to gauge the “accuracy” of a tool?
There are a lot of different ways to go about doing this, and after reading way too much about various measures of accuracy, our data scientists decided the best way would be to determine the percentage error ((Absolute(Actual Sales - Estimated Sales)/Actual Sales), and then take the median of those percentage errors (medians are more robust than means).
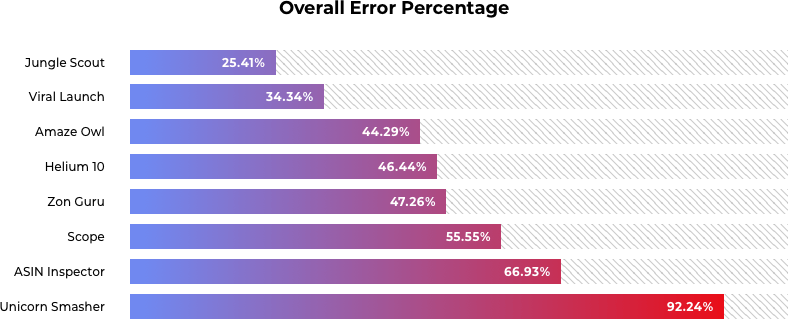
Jungle Scout’s median error was the closest to 0% which would indicate perfect accuracy - the lower, the better. It wasn’t perfect, but it was the most accurate out of all the tools tested.
If you were to run Jungle Scout on 10 different Amazon listings, the middle value is the most likely to be correct. Viral Launch and Amaze Owl were the next closest. And as you can see, Unicorn Smasher’s median error was the least accurate at 92%.
When you take a look at the relative percent difference between Jungle Scout's accuracy compared to each competitor (Median Percent Error for Jungle Scout - Median Percent Error of Competitor / Median Percent Error of Competitor) the scale of difference surpasses 40% for nearly every tool we challenged. It's relative to our own accuracy, but it still points to our success, and we'll take that win.
My Interpretation
- It was pretty interesting to look through the raw data and see that the majority of the time, the tools underestimate sales instead of overestimating.
- As a whole, I knew a lot of the tools were inaccurate, but I was surprised to see how poor some of them really were. I didn’t want to pick on any of the individual tools, but you would almost be better rolling dice than trying to estimate sales with Unicorn Smasher.
- If you’re using ASIN Inspector or Scope, you should adjust all the estimates by about -50% or -75%, a box and whisker plot shows the majority of their estimates are high.
- While Amaze Owl was the third best in the gauge of the median, their range of errors is one of the worst in the group. In other words, if you run it on a large number of ASINS, it works out to be pretty close to accurate. However, any single ASIN is likely to have a high potential for error.
- In addition to Amaze Owl, Helium 10, Unicorn Smasher and Zon Guru had a huge range of errors. While the median of some of them seems accepted, the range of errors seems too large to make them usable.
- Jungle Scout and Viral Launch, in my opinion, are the only 2 tools that have good sales estimates..
Although, from a relative standpoint, Jungle Scout is still about 30% more accurate than Viral Launch, based on the median values.
What Really Matters?
At the end of the day, sales estimates aren’t an indicator of guaranteed success, but they are a great indicator of demand on Amazon.
The best uses for sales estimates are to verify demand and to determine initial order quantities. When it comes to placing initial orders for products, it’s important to not under order, or over order. Too much inventory means excessive storage fees and your cash tied up in inventory that could have been put to better use elsewhere. Too little inventory means you run out of stock, lose keyword rank and miss out on profits.
With that being said, a relatively small investment in the most accurate tool on the market (you can get the Jungle Scout chrome extension for a hundred bucks) seems like a no-brainer when an incorrect inventory order or misunderstanding of market demand can mean losses in the thousands of dollars.
Raw Data
Interested in running your own analysis? Here are links to the raw data, Spreadsheet 1 and Spreadsheet 2.
Interested in watching 70 hours of data collecting video recordings? Enjoy these videos