Category Sizing
Get total market size, growth rate, and competitor density in one pull. Skip the hours of manual research usually needed to size an opportunity. A single answer replaces a full afternoon of dashboard work.
Example Questions
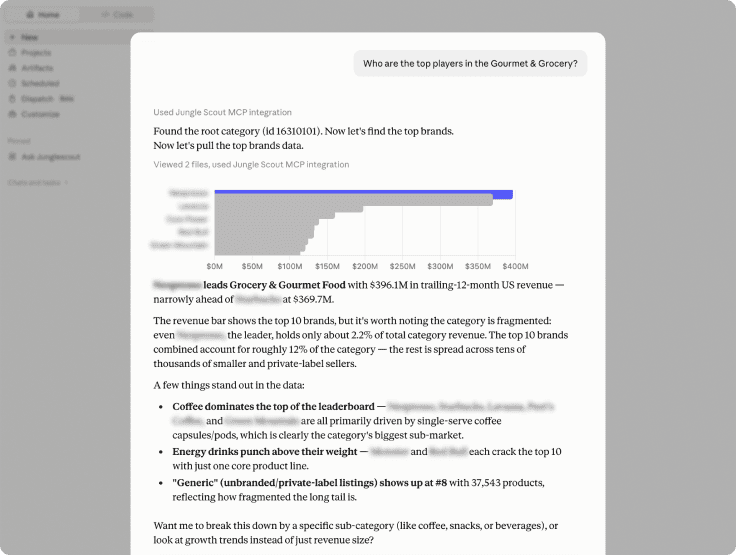
- “Who are the top players in [category]?”
- “Is [category] growing, and how fast?”
- “What does the 1P vs. 3P mix look like in [category]?”
- “Size [category] and break it down by sub-category, which slice is growing fastest and would be the best entry point for a new SKU?”
- “Compare category size and growth rate for [category A] vs [category B] and tell me which is the better long-term bet.”
- “What’s the TAM for [category], and how much of it is currently controlled by the top 3 brands vs. fragmented across smaller sellers?”
Frequently Asked Questions
It measures a category’s total revenue, unit volume, growth rate, and number of active brands and products, as defined by Amazon’s category structure. It can also break a category into sub-categories, show the 1P vs. 3P mix, and show how much of the market the top brands control.
Yes. It can size the closest existing category as a proxy, or a narrower niche within it, so you can estimate the opportunity before the product exists.
Growth is shown year over year using the most recent trailing period, so it reflects current momentum rather than a single snapshot.
Yes. You can compare the size and growth of two categories side by side, or rank sub-categories within one category to find the fastest-growing entry point for a new product.
In Ask Cobalt inside Jungle Scout Cobalt, and through the Jungle Scout MCP in AI tools like Claude and ChatGPT. Both draw on over a decade of Jungle Scout Amazon data covering more than 600 million products.
