Brand Performance
Your position in a category moves every week. Track revenue, share, and growth against the category over time, and build the baseline every other question about your brand depends on.
Example Questions
- “How is [brand] doing in [category]?”
- “Benchmark [brand] against the category.”
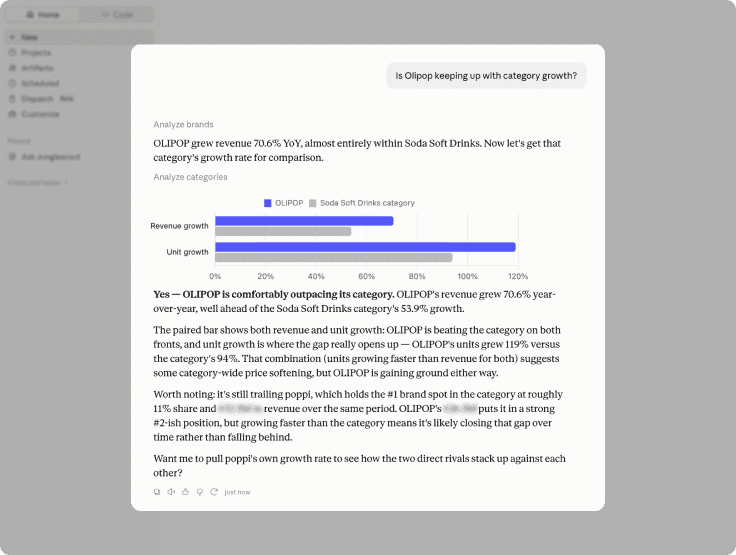
- “Is [brand] keeping up with category growth?”
- “Show [brand]’s revenue and share trend over the last 12 months against the category average, and flag any quarter where we diverged sharply in either direction.”
- “Which of [brand]’s products are growing faster than the category, and which are dragging the average down?”
- “Compare [brand] to where it stood a year ago on revenue, share, and price position; is our growth outpacing, matching, or lagging the category?”
Frequently Asked Questions
It tracks a brand’s revenue, market share, growth rate, and price position within a category over time. It also shows which of the brand’s products are growing faster than the category and which are dragging the average down.
Category Sizing measures the whole market. Brand Performance measures how one brand sits inside that market, including its revenue, share, and growth relative to the category.
Yes. The standard comparison is year over year, and you can adjust it to a shorter or longer window, such as the last 12 months by quarter.
It means comparing the brand’s growth rate to the category’s. If the category grows 10% and the brand grows 6%, the brand is growing but losing share, and Brand Performance flags that gap.
In Ask Cobalt inside Jungle Scout Cobalt, and through the Jungle Scout MCP in AI tools like Claude and ChatGPT.
