Pricing Strategy Analysis
Pricing by instinct leaves revenue on the table in one direction or the other. Surface the biggest price movers, elasticity, and revenue impact for a brand or category. Find out whether growth is coming from price or from volume.
Example Questions
- “Who’s discounting / premiumizing in [category]?”
- “Is [category]’s growth price-led or volume-led?”
- “How much of the category’s growth is just price?”
- “Break down [category]’s growth into price effect vs. volume effect over the last two quarters, and name the 5 products driving the biggest price-led revenue swings.”
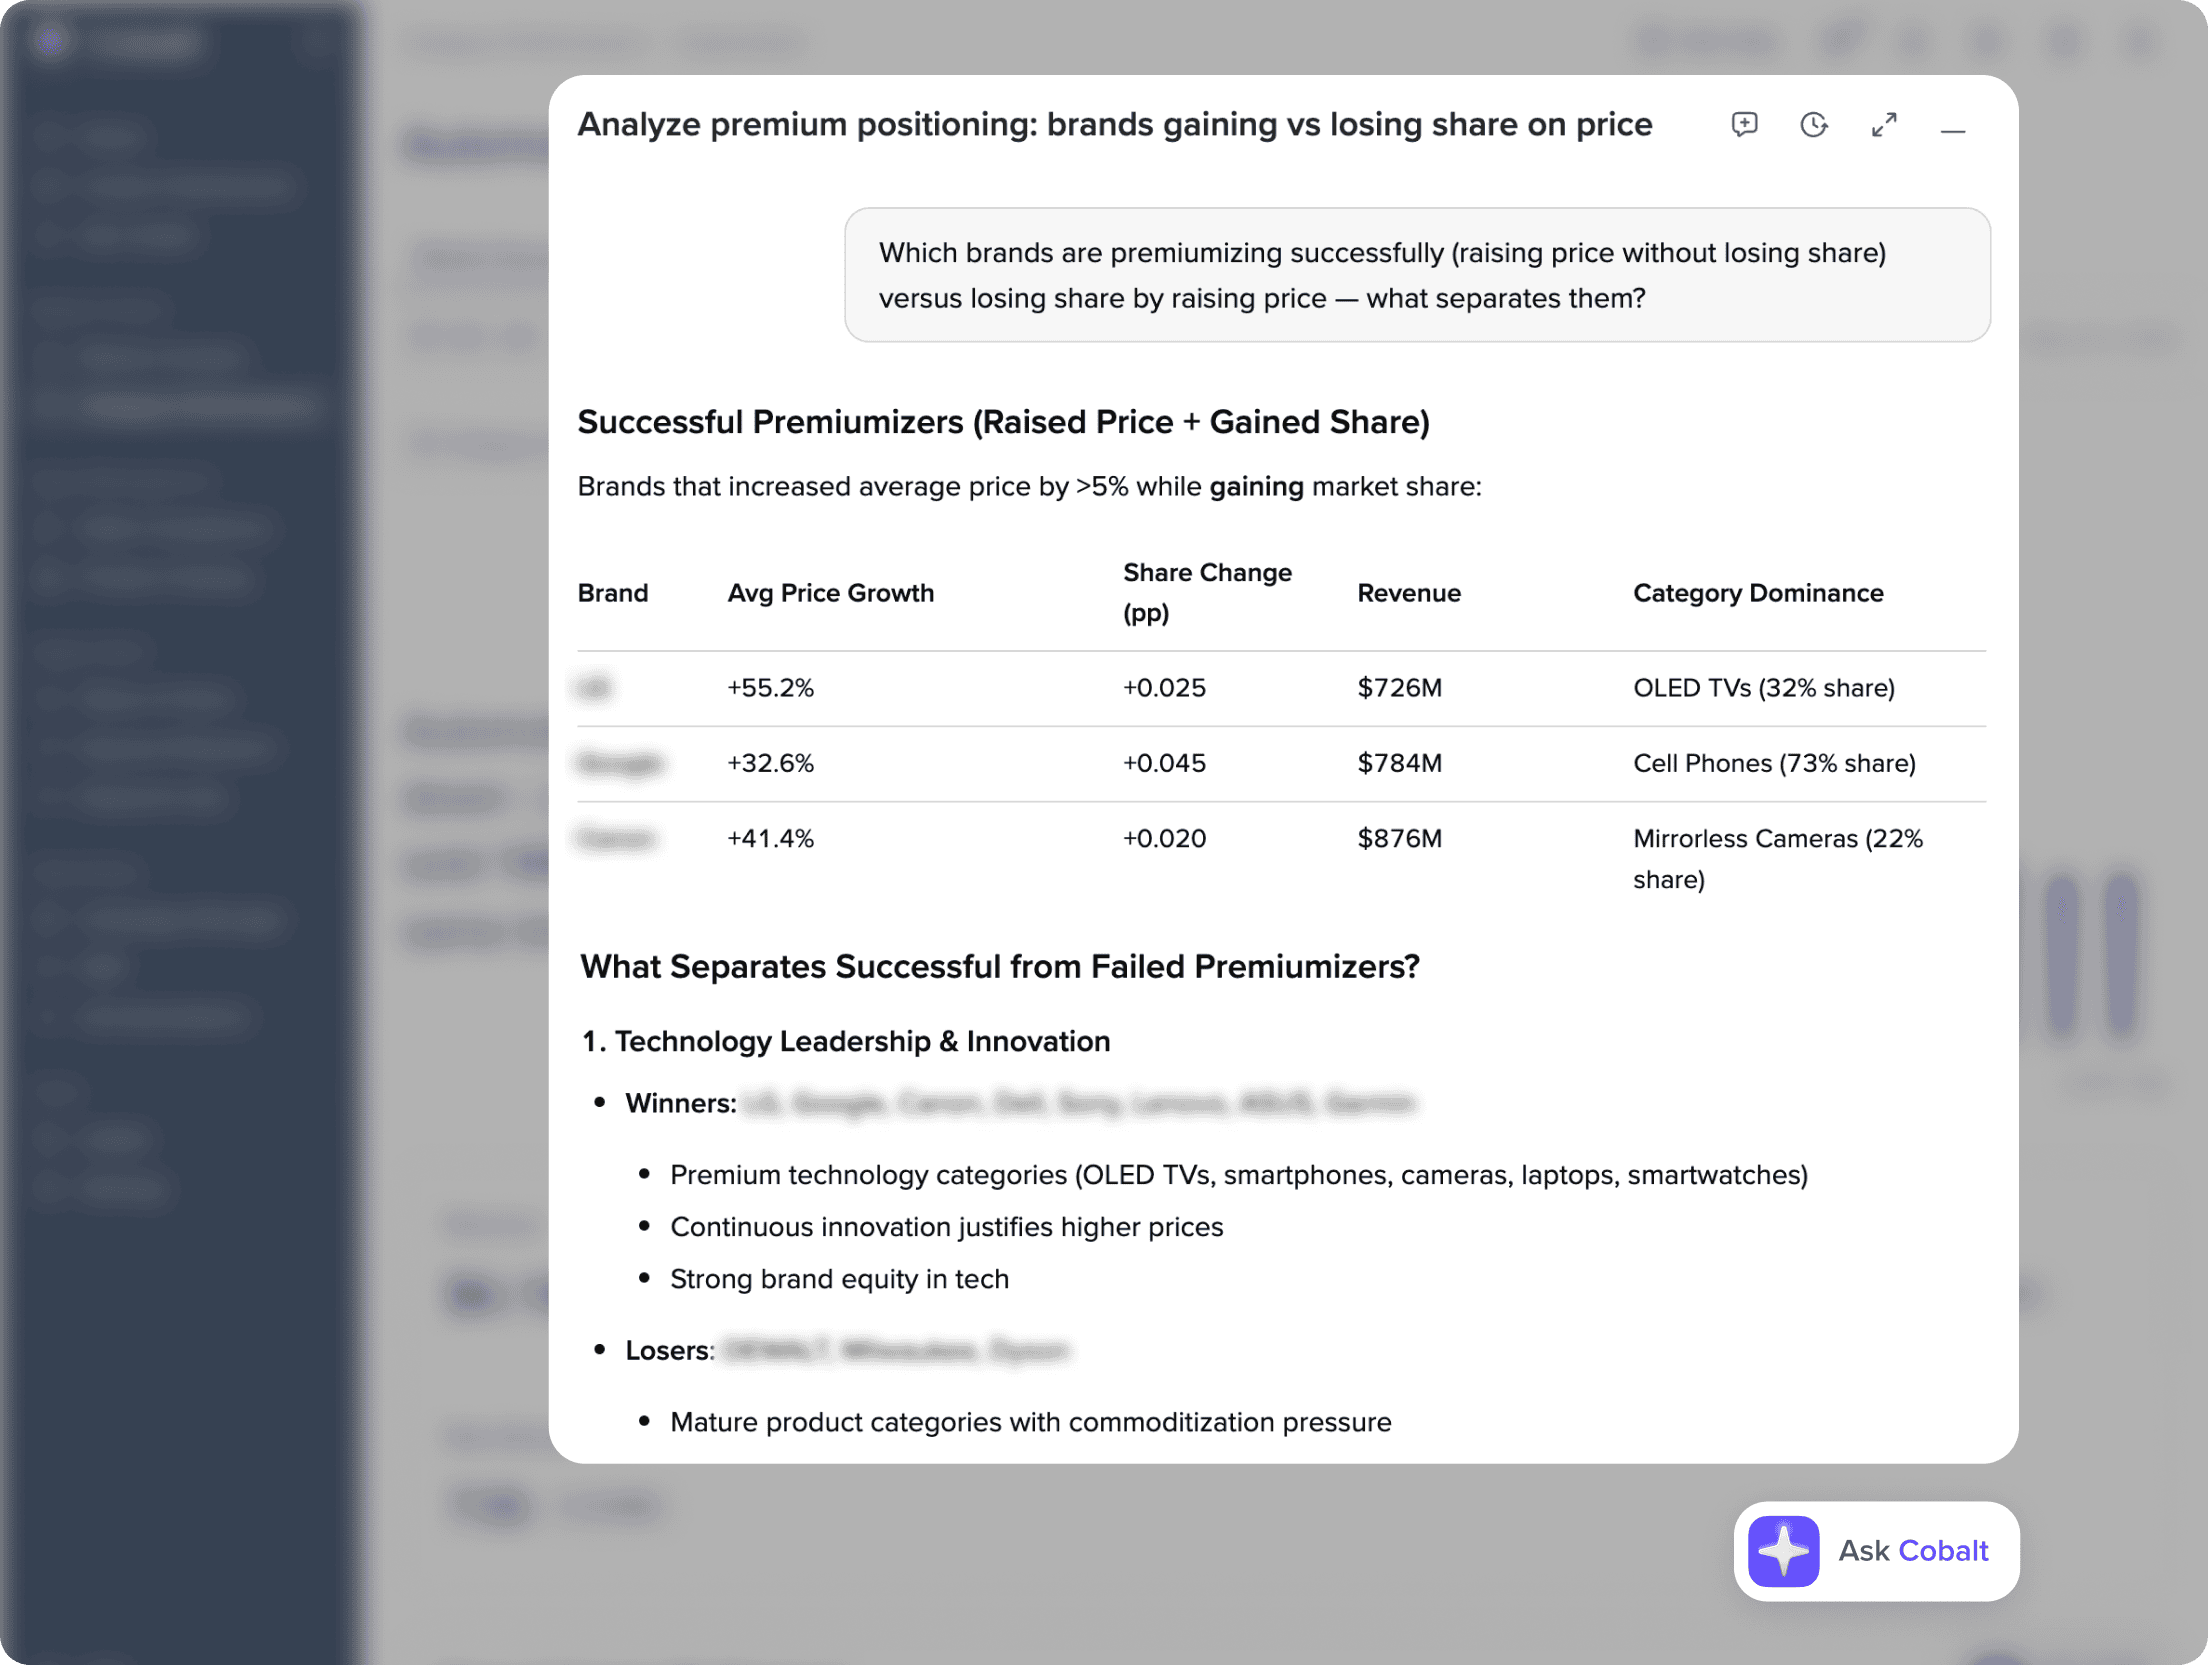
- “Which brands are premiumizing successfully (raising price without losing share) versus losing share by raising price — what separates them?”
- “What price point would maximize our revenue on [product], based on the elasticity we’re seeing across similar price tiers in the category?”
Frequently Asked Questions
It shows who is discounting or premiumizing in an Amazon category, which price ranges drive the most sales, how price-sensitive demand is, and the revenue impact of price moves. It works for a single brand or a whole category.
It splits revenue growth into two parts: the change from higher or lower prices and the change from more or fewer units sold. If a category grew 12% but units were flat, the growth was price-led.
Yes. It separates brands that raised prices without losing share from brands that lost share after a price increase, and shows what distinguishes them.
Yes. It can suggest a revenue-maximizing price for an existing product or a new launch, based on where sales volume sits in the category and how demand responds to price in similar tiers.
In Ask Cobalt inside Jungle Scout Cobalt, and through the Jungle Scout MCP in AI tools like Claude and ChatGPT.
