Ad Performance
Ad spend without a benchmark is just a number. Compare spend, Share of Voice, and efficiency against category norms and competitor behavior. Find out whether the budget is working, not just what it did last month.
Example Questions
- “What is our Share of Voice for [x] product?”
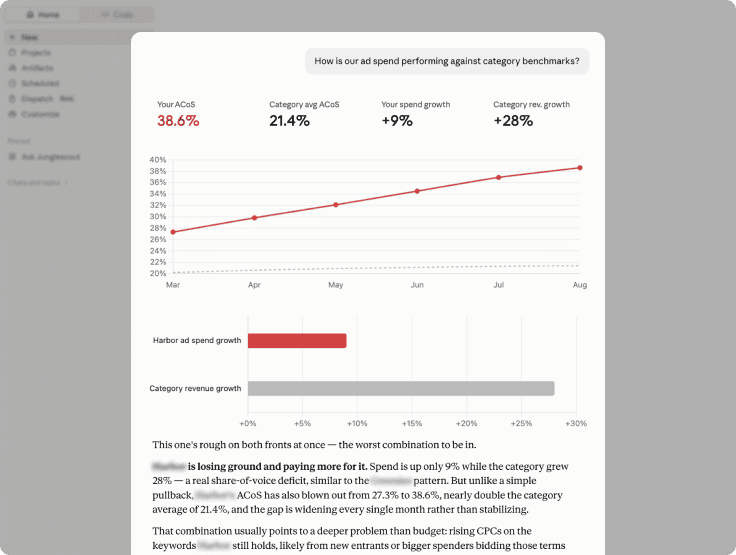
- “How is our ad spend performing against category benchmarks?”
- “Compare our ad spend efficiency (SOV per dollar) against the category average and our closest competitor — are we overspending or underspending relative to share gained?”
- “Which competitors are outspending us on ads in [category], and is their spend translating into actual share gains or just visibility?”
- “Is our Share of Voice keeping pace with our market share, or is there a growing gap that ad spend should be closing?”
Frequently Asked Questions
It benchmarks your Amazon ad spend, Share of Voice, and efficiency against the category average and your closest competitors. It shows whether your budget is winning share, not just what it spent.
It’s the typical Share of Voice, spend level, or efficiency across competitors in the same category. Your performance is compared against it to show whether you’re overspending or underspending relative to share gained.
Share of Voice measures your visibility in Amazon ad placements and search results. Market share measures your actual sales. Comparing the two shows whether your visibility is ahead of, behind, or in line with your sales position.
Yes. It flags competitors increasing ad investment in a category and whether that spend is turning into share gains. Rising competitor spend is often an early signal before a share shift shows up in sales.
In Ask Cobalt inside Jungle Scout Cobalt, and through the Jungle Scout MCP. To turn a gap it finds into a spend and keyword plan, see Ad & SOV Optimization.
