 No Comments


According to Jungle Scout’s consumer trends survey, a whopping 25% of consumers splurged more on their pets in the second quarter of this year than the first.
In a smaller survey among pet owners, over half said they shop for pet products at least once a week, and nearly a quarter said Amazon is their most frequent go-to for pet products.
- 53% of pet owners shop for pet products at least once a week
- 35% of pet owners primarily shop online for pet products
- 24% of pet owners shop for pet products most frequently on Amazon
To learn more about how consumers are shopping for their furry friends this year, we sniffed out the juiciest data in over 20 pet product markets – from kibble and treats to toys and grooming supplies. Curl up with your favorite four-legged buddy and get ready to dig into the findings.
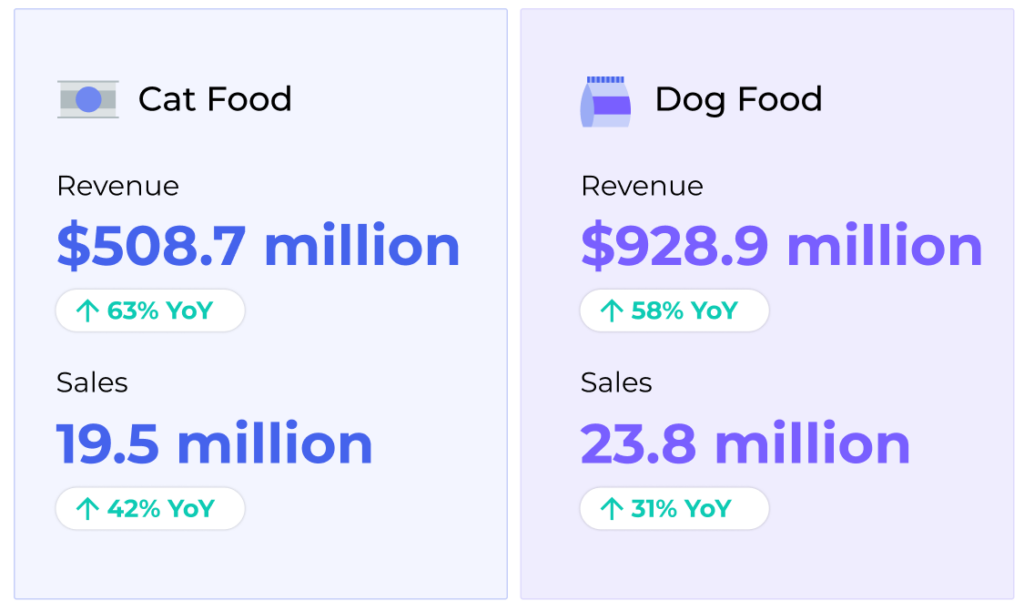
Pet food reigns supreme: The $1.4 billion industry on Amazon
Food leads the pack in sales and revenue across 20 pet product sub-categories. And the markets for cat and dog food are continuing to grow: revenue is up approximately 60% year-over-year, while sales have grown 30-40%.
The competition is getting fiercer, too. There are 13% more brands and 16% more products in the cat food market year-over-year, and there are 10% more brands and 13% more products in the dog food market.
What are consumers searching for in pet food?
So what’s cooking when it comes to pet food search trends? Brand loyalty is the name of the game for shoppers. For both cat food and dog food, consumers are heavily searching for products by specific brand names, with some searches seeing 5,000%+ growth in recent months:
90-Day pet food search trends on Amazon
| Search Term | 90-Day Search Trend |
| Pedigree wet food | Up 11,212% |
| Taste of the Wild dry dog food | Up 8,248% |
| Hills Science dog food | Up 6,377% |
| Rachael Ray dog food dry | Up 5,218% |
| Kibbles ‘N Bits dog food | Up 3,057% |
| Fancy Feast cat food | Up 1,255% |
| Sheba turkey pate | Up 1,025% |
| Iams high protein cat food | Up 1,011% |
| Purina Pro Plan indoor cat food | Up 1,011% |
| Hill’s Science Diet cat food light | Up 1,011% |
Also on the rise is the demand for pet food that has natural ingredients and less filler fluff like grain.
90-Day natural pet food search trends on Amazon
| Search Term | 90-Day Search Trend |
| Purina One natural smartblend dog food | Up 1,011% |
| Dog food fresh | Up 990% |
| Purina Naturals grain free dry cat food | Up 985% |
| Rachael Ray dog food nutrish grain free | Up 972% |
| Fancy Feast gourmet naturals in gravy | Up 959% |
| Beyond grain free cat food | Up 848% |
| Cat Chow naturals dry cat food | Up 748% |
| Whole Earth Farms dog food small breed | Up 741% |
| Castor & Pollux Organix dog food | Up 740% |
| Blue Buffalo grain free cat food | Up 671% |
When surveyed, 65% of pet owners said the most important factor when choosing pet food is the quality of the ingredients.
“I like to look for food and treats made from whole food ingredients. Just like when I shop for my family, I look at the ingredient list to make sure I know what is in the product. I don’t want anything artificial or bad for my pet that could lead to allergies or something worse.” – Kerry Sell, dog owner
Who are the leading brands in cat food?
Purina is the cat’s meow for pet parents feeding their whiskered friends. Purina claimed not one, not two, but three of the top five market share spots for cat food on Amazon in the first half of this year.
Top cat foods brands on Amazon, by market share
- Purina Fancy Feast – 13%
- Friskies – 9%
- Blue Buffalo – 9%
- Purina Pro Plan – 7%
- Purina One – 6%
One of those brands – Purina One – had the largest year-over-year sales and revenue growth among all of the market share leaders.
Sales and revenue trends for cat food market share leaders
| Brand | YoY Revenue Trend | YoY Sales Trend |
| Purina Fancy Feast | Up 69% | Up 63% |
| Friskies | Up 82% | Up 58% |
| Blue Buffalo | Up 22% | Up 12% |
| Purina Pro Plan | Up 62% | Up 24% |
| Purina One | Up 113% | Up 71% |
Who are the leading brands in dog food?
Purina is a crowd-pleaser among dog owners, too, claiming two of the top five market share spots in this market – including the top spot. But there’s a market share tug-of-war happening between the top two brands, with Blue Buffalo just 1% behind Purina Pro Plan.
Top dog food brands on Amazon, by market share
- Purina Pro Plan – 12%
- Blue Buffalo – 11%
- Hill’s Science Diet – 8%
- Purina One – 5%
- Wellness – 4%
And just like with cat food, Purina One had the highest year-over-year sales and revenue growth among the market share leaders for dog food.
Sales and revenue trends for dog food market share leaders
| Brand | YoY Revenue Trend | YoY Sales Trend |
| Purina Pro Plan | Up 63% | Up 33% |
| Blue Buffalo | Up 64% | Up 32% |
| Hill’s Science Diet | Up 48% | Up 26% |
| Purina One | Up 93% | Up 66% |
| Wellness | Up 83% | Up 50% |
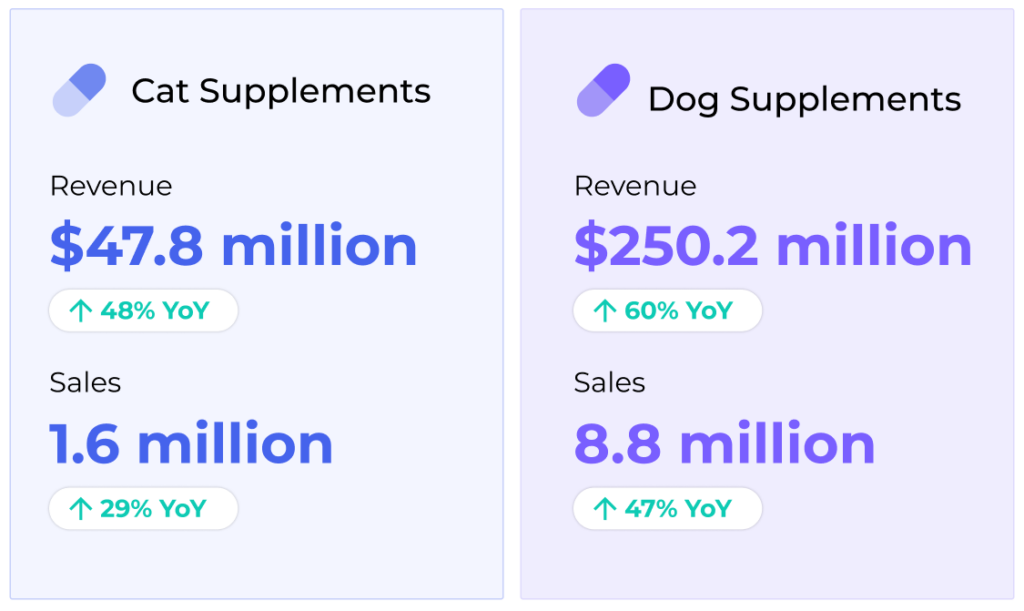
Pet supplements and the 50 million dollar mark: The growth of a niche market
The pet supplements market is booming on Amazon. In June, revenue for pet supplements surpassed $50 million – a new record for this market. In 2022, the highest-revenue month had $35 million, and in 2021 it had just $29 million.
Overall, pet supplements generated nearly $300 million in revenue in the first half of the year. Dog supplements fetched over $250 million, with over 5 times more sales than cat supplements.
What are consumers searching for in pet supplements?
Search trends on Amazon suggest that more pet parents are embracing the world of supplements. 35% of pet owners surveyed said they give their pets daily vitamins or supplements.
90-Day pet supplements and vitamins search trends on Amazon
| Search | 90-Day Trend |
| Joint support supplement for dogs | Up 2,310% |
| Hyperthyroidism supplements for cats | Up 972% |
| Cat cranberry treats urinary | Up 947% |
| Nutrivet multivite for cat | Up 935% |
| Rx vitamins nutritional support for cats | Up 935% |
| Dog senior vitamins | Up 923% |
| Pet nc hip and joint supplement for dogs | Up 918% |
| Ruff greens supplement for dogs | Up 902% |
| Salmon oil chews for dogs | Up 874% |
| Fish oil for cats | Up 863% |
Who are the leading brands in cat supplements?
Top cat vitamin and supplement brands on Amazon, by market share
- Purina – 14%
- Vetoquinol – 9%
- HawaiiPharm – 8%
- PetHonesty – 7%
- Bark & Spark – 5%
While Purina leads in market share, it’s the third brand on the list – HawaiiPharm – that has seen the biggest year-over-year sales and revenue growth, outpacing all four other market share leaders by more than 700%.
Sales and revenue trends for cat supplements market share leaders
| Brand | YoY Revenue Trend | YoY Sales Trend |
| Purina | Up 58% | Up 46% |
| Vetoquinol | Up 57% | Up 28% |
| HawaiiPharm | Up 856% | Up 847% |
| PetHonesty | Up 22% | Up 26% |
| Bark & Spark | Up 102% | Up 116% |
Who are the leading brands in dog supplements?
HawaiiPharm has grown its footprint in the dog supplements market as well, increasing market share by 240% in the first half of the year. However, it still trails well behind Zesty Paws, the brand currently sitting in the top spot.
Top dog vitamin and supplement brands on Amazon, by market share
- Zesty Paws – 12%
- Purina – 7%
- PetHonesty – 6%
- HawaiiPharm – 4%
- Nutramax Laboratories – 4%
HawaiiPharm’s market share growth efforts seem to be paying off, boosting revenue and sales by over 440% year-over-year.
Sales and revenue trends for dog supplements market share leaders
| Brand | YoY Revenue Trend | YoY Sales Trend |
| Zesty Paws | Up 78% | Up 73% |
| Purina | Up 111% | Up 139% |
| PetHonesty | Up 34% | Up 30% |
| HawaiiPharm | Up 447% | Up 470% |
| Nutramax Laboratories | Up 76% | Up 53% |
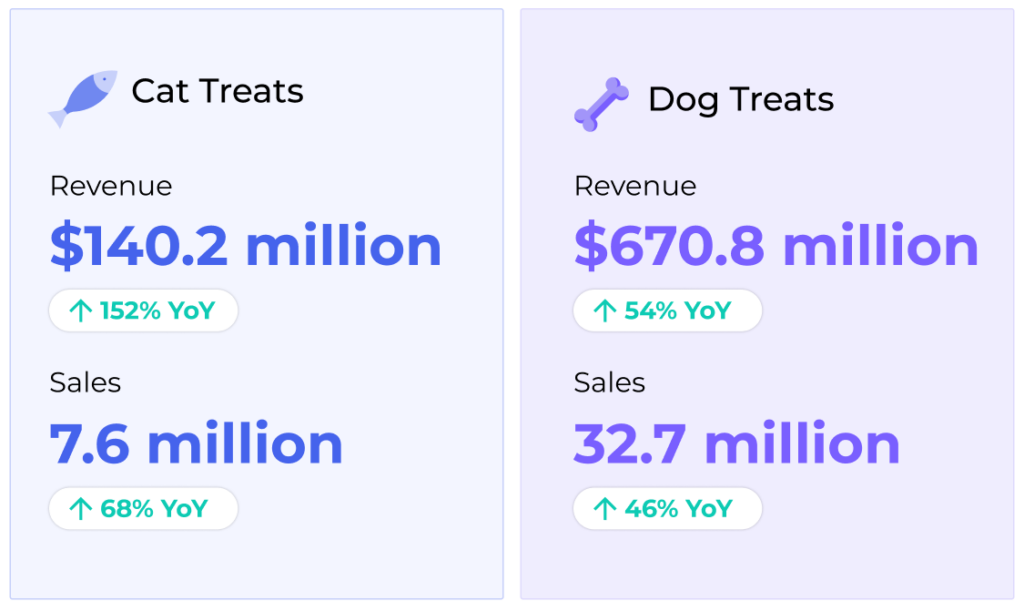
Cat treats vs. dog treats: A tale of two tastes
Are cats becoming man’s new best friend? Although dog treats have more overall revenue, cat treats had nearly three times the year-over-year revenue growth in the first half of the year.
In fact, cat treats had the highest year-over-year revenue growth across 22 pet products sub-categories, followed by cat houses, cat toys, and cat food.
Year-over-year revenue growth for pet products
| Product | Revenue (YoY) |
| Cat treats | 152% |
| Cat houses, towers, trees | 68% |
| Cat toys | 68% |
| Cat food | 63% |
| Dog food | 58% |
| Dog treats | 54% |
| Dog supplements/vitamins | 50% |
| Cat supplements/vitamins | 48% |
| Dog toys | 46% |
| Dog brushes | 43% |
| Cat brushes | 41% |
| Cat shampoo/conditioner | 38% |
| Dog leashes | 32% |
| Dog shampoo/conditioner | 28% |
| Dog beds | 27% |
| Dog poo bags | 26% |
| Cat harnesses | 21% |
| Cat beds | 21% |
| Dog collars | 20% |
| Cat collars | 19% |
| Dog harnesses | 10% |
| Cat leashes | 1% |
For both cats and dogs, treats are the highest revenue-generating products aside from food.
What are consumers searching for in pet treats?
Much like pet food, consumers often search for pet treats by brand name, though other product characteristics seem to be drawing attention, too. Searches for healthy treats, treats made in the United States, and long-lasting dog chews are all on the rise.
90-Day pet treats search trends on Amazon
| Search term | 90-Day trend |
| Churus for cats | Up 10,657% |
| Temptations treats | Up 1,019% |
| Cat dental sticks | Up 988% |
| Delectables squeeze up | Up 988% |
| Cat treats healthy | Up 957% |
| Bocce’s bakery dog treats | Up 5,405% |
| Busy bones for dogs | Up 4,655% |
| Dog treats made in USA only | Up 3,773% |
| Dingos for dogs | Up 1,948% |
| Long lasting dog chews for large dogs | Up 1,701% |
Who are the leading brands in cat treats?
Hartz has clawed its way to the top of the cat treats category, growing market share by 127% since the first of the year. Temptations is close behind, with a 4% difference between the two brands.
Top cat treats brands on Amazon, by market share
- Hartz – 31%
- Temptations – 27%
- Greenies – 5%
- Inaba – 5%
- Friskies – 5%
Hartz also leads the way on year-over-year sales and revenue growth among market share leaders for cat treats, with revenue soaring more than 450% and sales growing by over 150%.
Sales and revenue trends for cat treats market share leaders
| Brand | YoY Revenue Trend | YoY Sales Trend |
| Hartz | Up 476% | Up 157% |
| Temptations | Up 159% | Up 63% |
| Greenies | Up 18% | Up 20% |
| Inaba | Up 206% | Up 139% |
| Friskies | Up 103% | Up 75% |
Who are the leading brands in dog treats?
Digging our paws into the world of dog treats, Milk-Bone and Greenies are topping the list of market share leaders, with 7% market share each. Although it’s last on the top 5 list, Afreschi had the most market share growth (67%) in the first half of the year.
Top dog treats brands on Amazon, by market share
- Milk-Bone – 7%
- Greenies – 7%
- Pawstruck – 4%
- Good ‘N Fun – 4%
- Afreschi – 3%
Unlike with other product types, the leaders for year-over-year sales and revenue trends are split for dog treats. Afreschi had the most revenue growth, while Milk-Bone has seen the biggest increase in sales.
Sales and revenue trends for dog treats market share leaders
| Brand | YoY Revenue Trend | YoY Sales Trend |
| Milk-Bone | Up 108% | Up 62% |
| Greenies | Up 49% | Up 26% |
| Pawstruck | Down 31% | Up 42% |
| Good ‘N Fun | Up 88% | Up 41% |
| Afreschi | Up 158% | Up 25% |
Pouncing on Amazon pet product trends
Consumer spending on pet products is on the rise, and Amazon remains a popular shopping destination for pet owners. Search trends reveal the importance of brand loyalty to consumers, highlighting an opportunity for brands and retailers to invest in building a strong brand identity and reputation through consistent product quality and positive customer experiences.
There is also room for brands to differentiate themselves by highlighting the product characteristics that are emerging as most important to pet parents – such as natural ingredients and health benefits for their cats and dogs. One way to do so is by leveraging one of the fastest-growing trends in pet products: vitamins and supplements. By appealing to shoppers’ growing demand for health-focused pet products, brands can attract more customers and strengthen their presence in Amazon’s pet products market.
About this report
The product data in this report is representative of the U.S. Amazon market. Market insights on Amazon products were sourced from Jungle Scout Cobalt, an industry-leading market intelligence, advertising optimization, and ecommerce reporting platform powered by nearly 2 billion Amazon data points. Year-over-year comparison data reflects the period of January 1, 2023 – June 30, 2023, as compared to the period of January 1, 2022 – June 30, 2022. 90-day trends data reflects the 90 days leading up to July 29, 2023.
We encourage you to share, reference, and publish this report’s findings with attribution to “Jungle Scout Cobalt” and a link to this page.For more information, specific data requests, media assets, or to reach the report’s authors, please contact us at [email protected].