 8 Comments


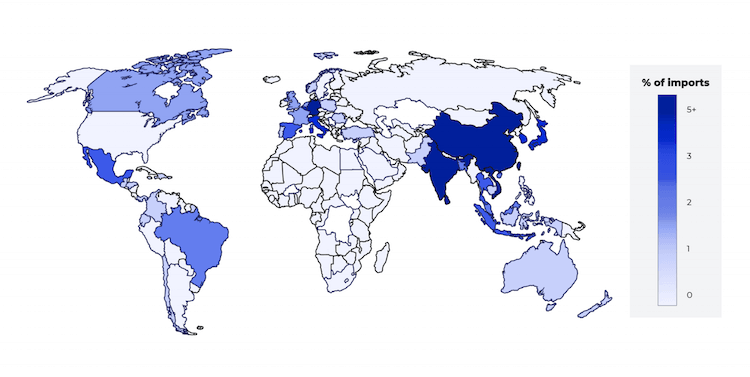
If you’ve read our 2021 Global Imports Report, you know that global trade has undergone significant shifts in the past few years. In the last 12 months alone, the U.S.’s leading trade partners have dealt with interruptions in manufacturing, supply chain delays, and shifts in share of total U.S. imports. Variations like these affect Amazon sellers, many of whom source products to sell online from overseas suppliers.
While the majority of Amazon sellers (78%) work with suppliers in China, there are plenty of other places around the world where sellers can find high-quality manufacturers.
We analyzed millions of import records spanning 2015 to 2021 to help sellers understand where they should source their next product. Let’s dive into the data to see which countries are your best bet for finding the right supplier, based on your desired product category.
Where to Source Products by Import Category
U.S. seaports receive millions of shipments of imported goods each year. These goods are grouped into 15 categories depending on their materials and intended use.
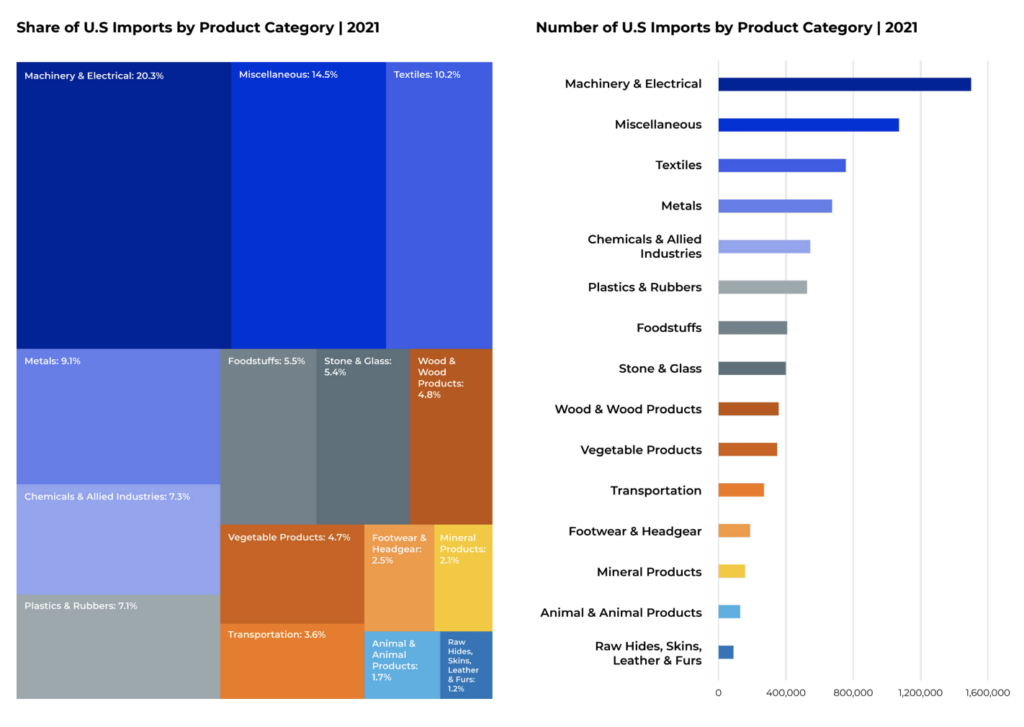
Imports include goods at every stage of the production process, from raw copper ore to ticking Timex watches. So while some products are decidedly not Amazon-friendly — bulk hydrogen gas is not Prime-eligible, for example — sellers can find profitable product ideas within each of the largest categories of U.S. imports.
As experienced sellers know, China is home to many high-quality Amazon suppliers. Import records show China dominating every U.S. import category; products from China account for roughly 42% of all U.S. imports in 2021.
But there are plenty of other countries with skilled suppliers equipped to collaborate with Amazon sellers. So let’s take a look at which countries lead the way within the top categories for U.S. imports and Amazon products.
1. Machinery & Electrical
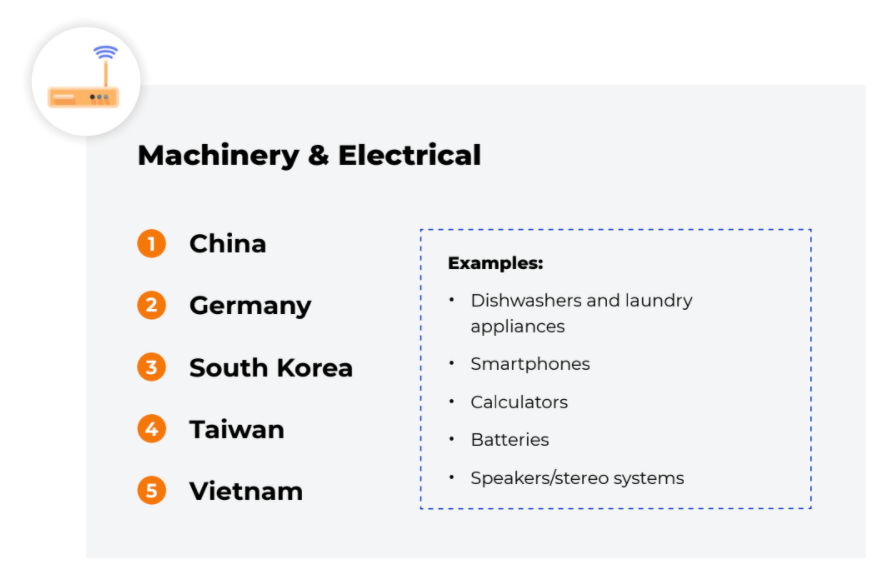
Machinery and electrical products make up the top U.S. import category, accounting for 20% of all goods imported in the United States.
While “machinery” may call to mind items that are unfit for FBA purposes — think boilers, jet turbines, and bulldozers — sellers can still choose from a wide variety of products to sell under the top Amazon product categories. Small kitchen appliances, smoke detectors, and hair dryers alone knock out Home & Kitchen, Tools & Home Improvement, and Beauty & Personal Care, respectively.
Where can sellers find Machinery & Electrical suppliers?
2. Miscellaneous
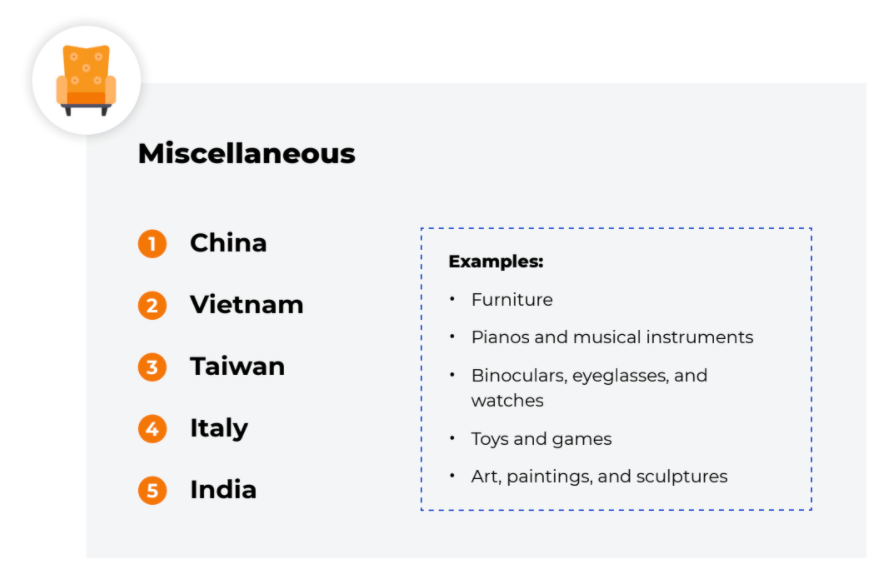
As the name suggests, imported products categorized as Miscellaneous fall across a broad spectrum, comprising 15% of all U.S. imports. This category is a treasure trove of the most-listed Amazon product categories. Items like furniture, musical instruments, art, clocks, toys, sports equipment, pencils, and buttons all fall under the Miscellaneous umbrella. No matter the Amazon product category, you’re likely to find a variety of potential listings among these imports.
Where to find Miscellaneous suppliers:
- Vietnam
- Taiwan
- Italy
- India
3. Textiles
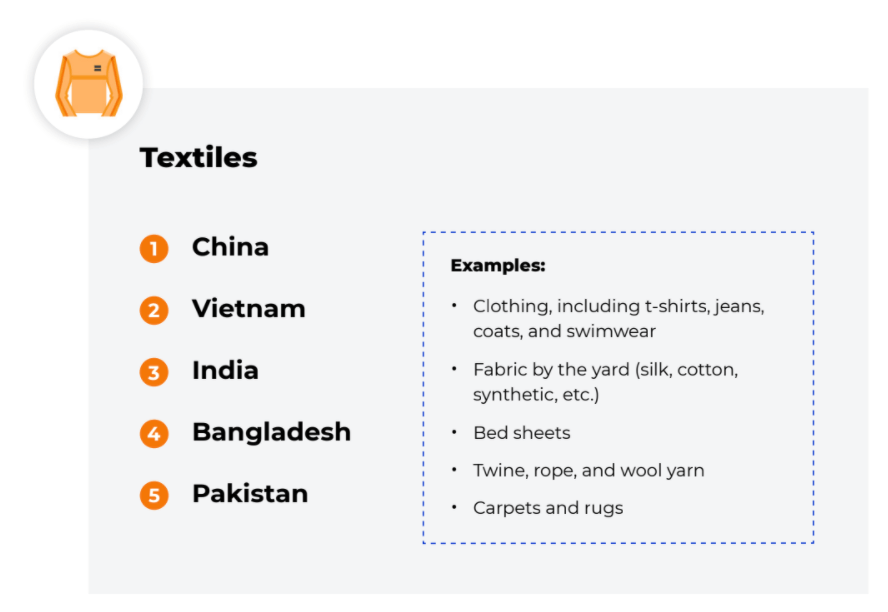
Textiles make up 10% of all U.S. imports and cover a vast swath of profitable products within the Home & Kitchen, Baby, and Clothing, Shoes, & Jewelry categories on Amazon. Profitable Amazon products include clothes, rugs, bedlinen, and fabric.
Sellers should note that shoes and hats are categorized under a separate import category known as Footwear & Headgear—and while this makes up a relatively smaller share of total U.S. imports than Textiles, it still contributes millions of imports to the U.S. each year.
Vietnam is a rising star in U.S. textiles imports, outpacing its rivals in share of U.S. textiles imports for 2020.
Where else to find Textiles suppliers:
- Bangladesh
- India
- Pakistan
4. Metals
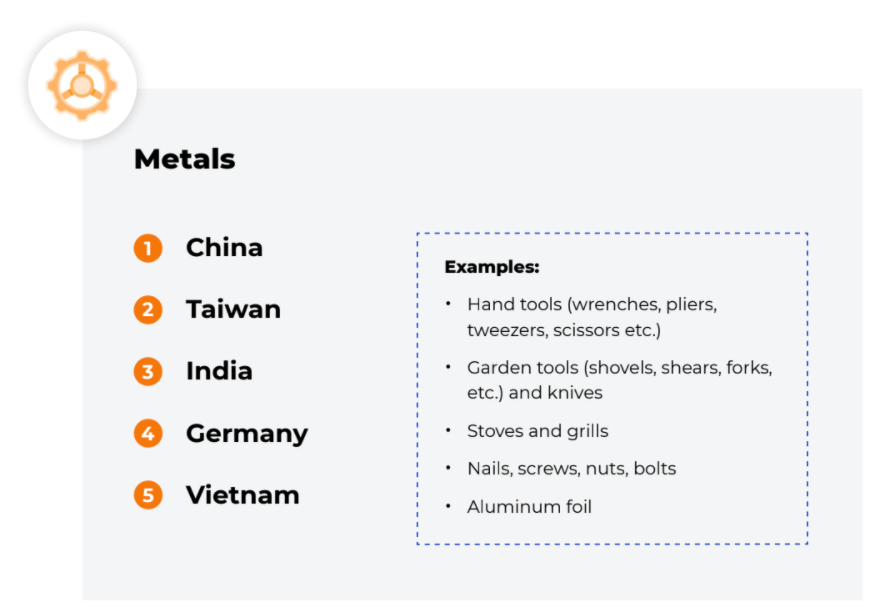
The Metals category, accounting for 9% of U.S. imports in 2021, includes small tools and hardware with low production costs. This includes cutlery, nails and screws, and knitting needles. Sellers can list products like these in Home & Kitchen, Garden & Outdoor, Tools & Home Improvement, and Arts, Crafts & Sewing.
Where to find Metals suppliers:
- Taiwan
- Germany
- India
- Vietnam
- Japan
5. Chemicals & Allied Industries
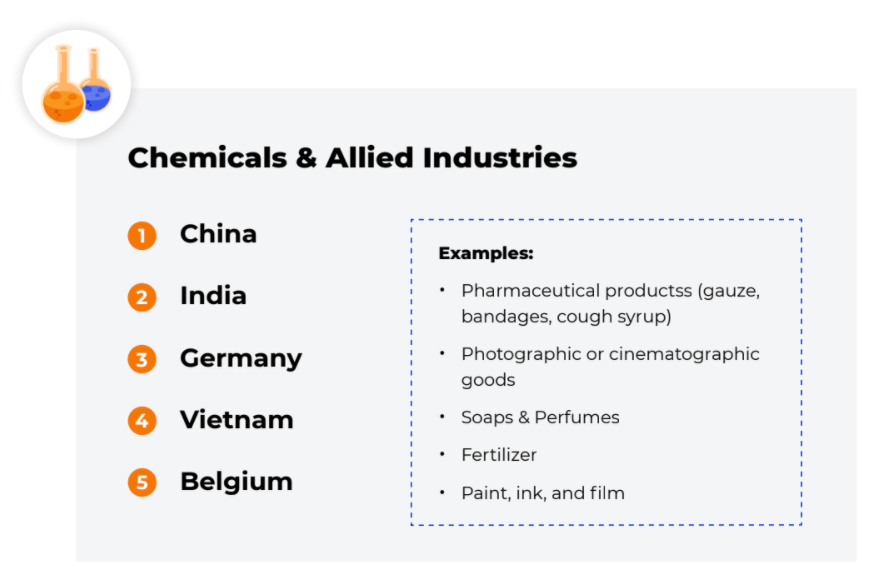
Chemicals and allied industries include household items like soap, cough syrup, and lawn fertilizer. In 2021, these goods account for 7% of all U.S. imports.
Where to find chemicals suppliers:
- India
- Germany
- Belgium
- South Korea
Other Import Categories
The remaining import categories make up smaller shares of total U.S. imports, but still offer profitable niche opportunities for Amazon sellers. They are, in order from largest to smallest in 2020:
6. Plastics & Rubber
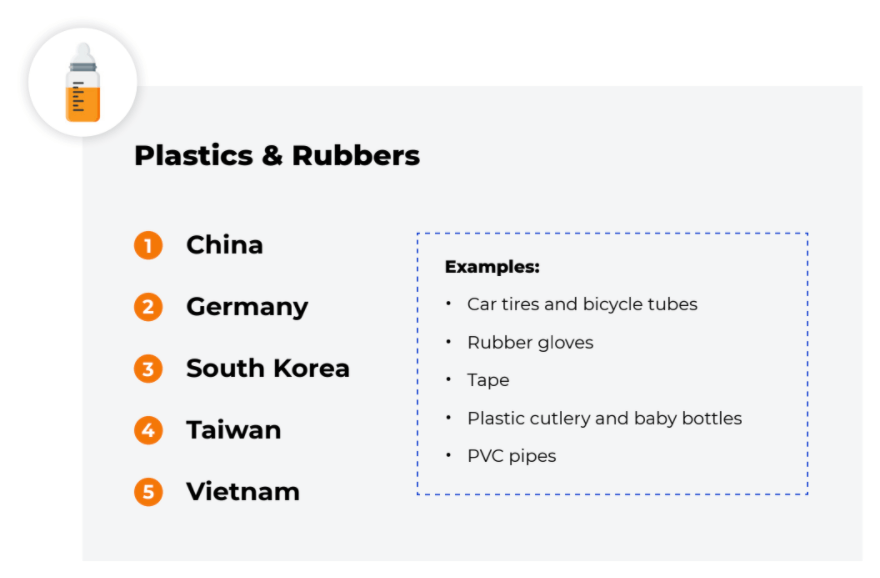
- 7% of all U.S. imports
- Product examples: car tires, tape, PVC pipes
- Top importers: China, Germany, South Korea, Taiwan, Vietnam
7. Foodstuffs
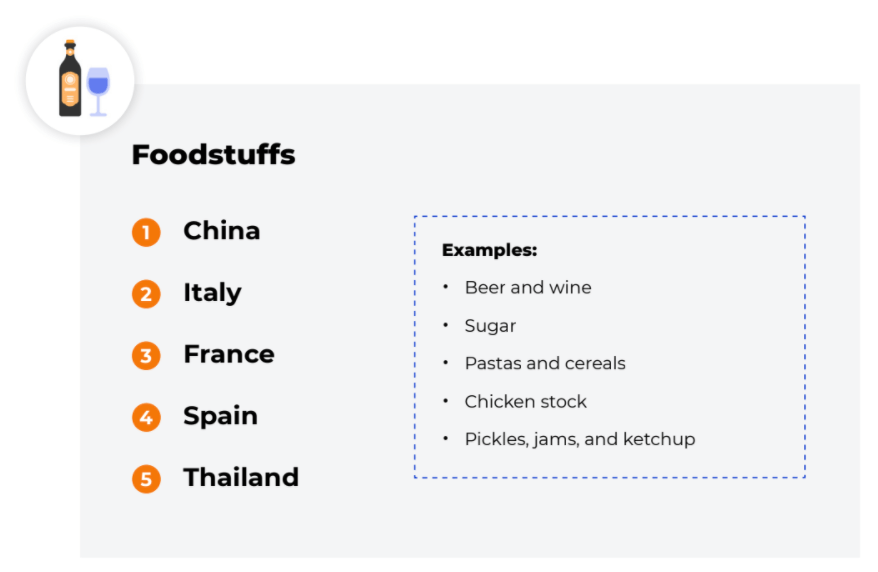
- 6% of all U.S. imports
- Product examples: dry pasta, pickles, sugar, and cereal
- Top importers: China, Italy, France, Spain, and Thailand
8. Stone & Glass
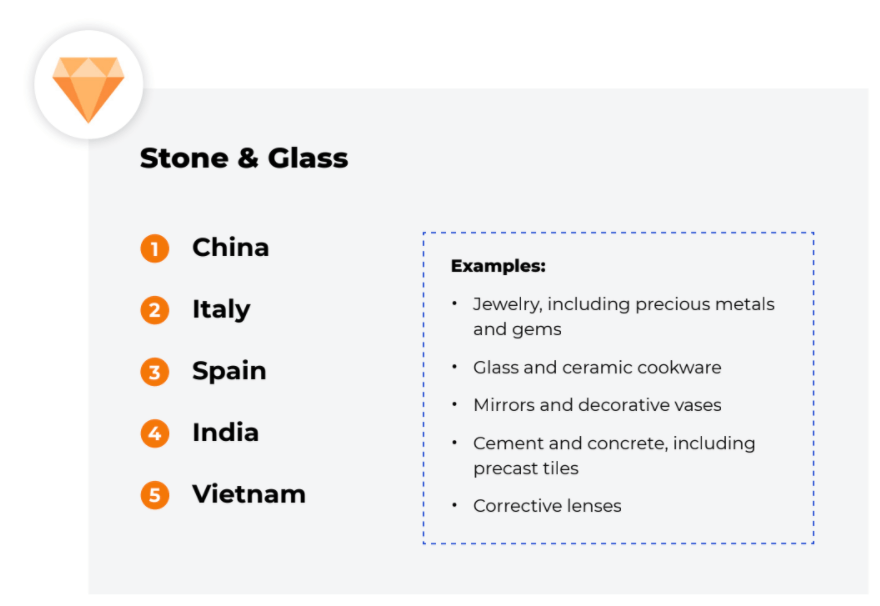
- 5% of all U.S. imports
- Product examples: jewelry, ceramic cookware, mirrors, and precast cement tiles
- Top importers: China, Italy, Spain, India, and Vietnam
9. Wood & Wood Products
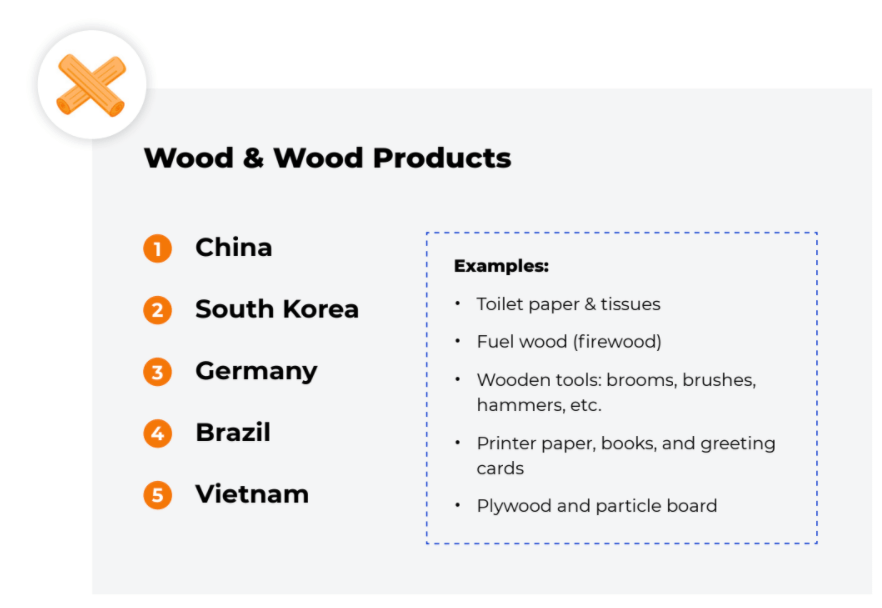
- 5% of all U.S. imports
- Product examples: Jungle Stix, toilet paper, firewood, and books
- Top importers: China, Germany, South Korea, Brazil, and Vietnam
10. Vegetable Products
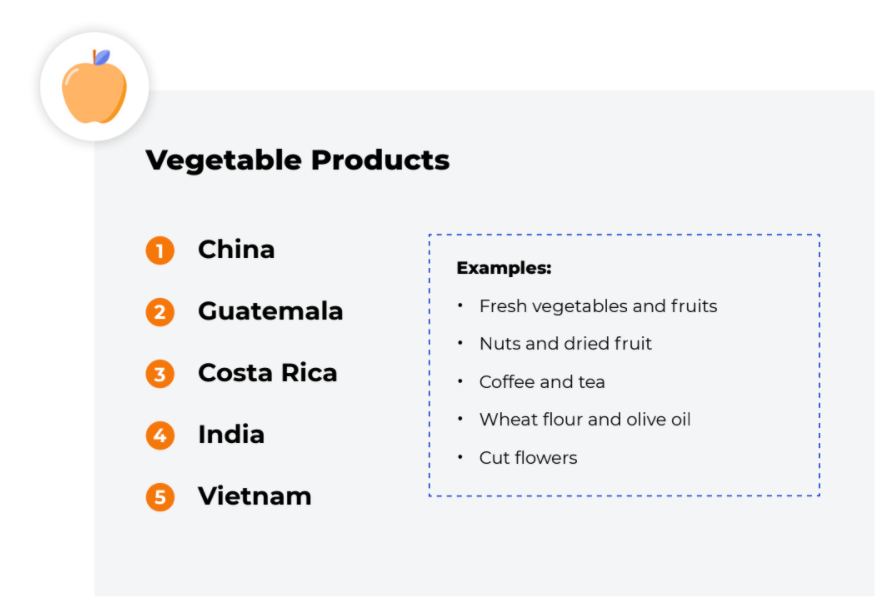
- 5% of all U.S. imports
- Product examples: coffee beans, flour, olive oil, nuts, and dried fruit
- Top importers: China, Guatemala, Costa Rica, India, and Vietnam
11. Transportation
![]()
- 4% of all U.S. imports
- Product examples: parts and accessories for cars, bicycles, and baby strollers
- Top importers: China, India, Japan, Germany, and Taiwan
12. Footwear & Headgear
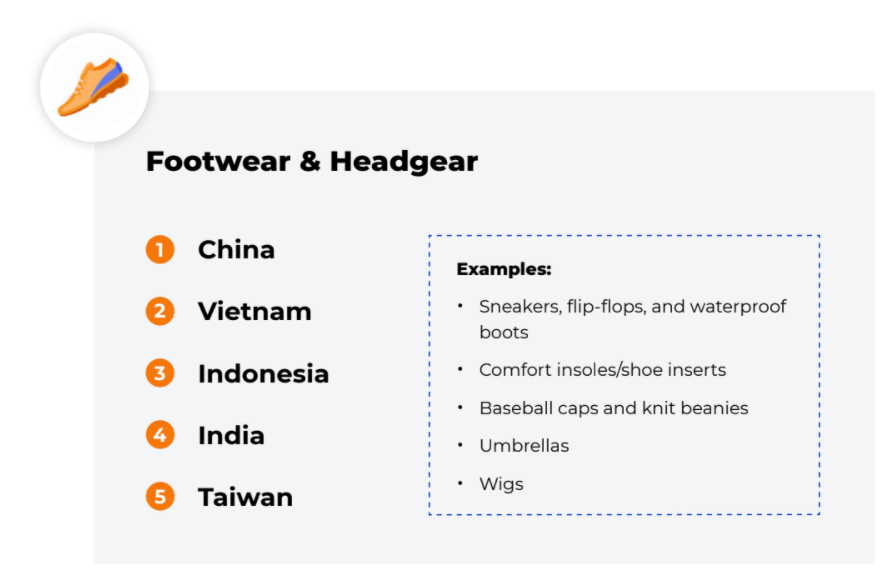
- 3% of all U.S. imports
- Product examples: flip-flops, shoe inserts, baseball hats, and umbrellas
- Top importers: China, Vietnam, Indonesia, Taiwan, and India
13. Mineral Products
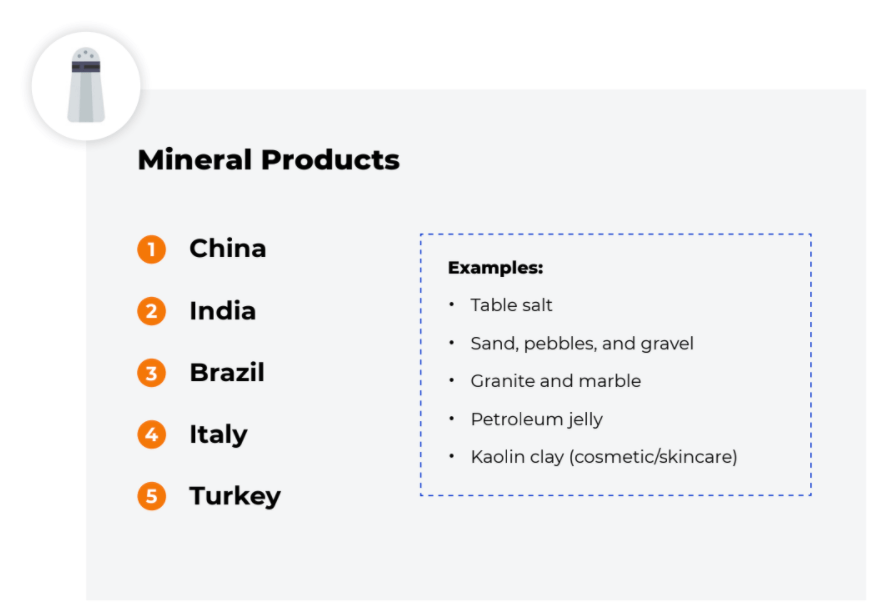
- 2% of all U.S. imports
- Product examples: gravel, cosmetic kaolin clay, and table salt
- Top importers: China, Brazil, Italy, India, and Turkey
14. Animals & Animal Products
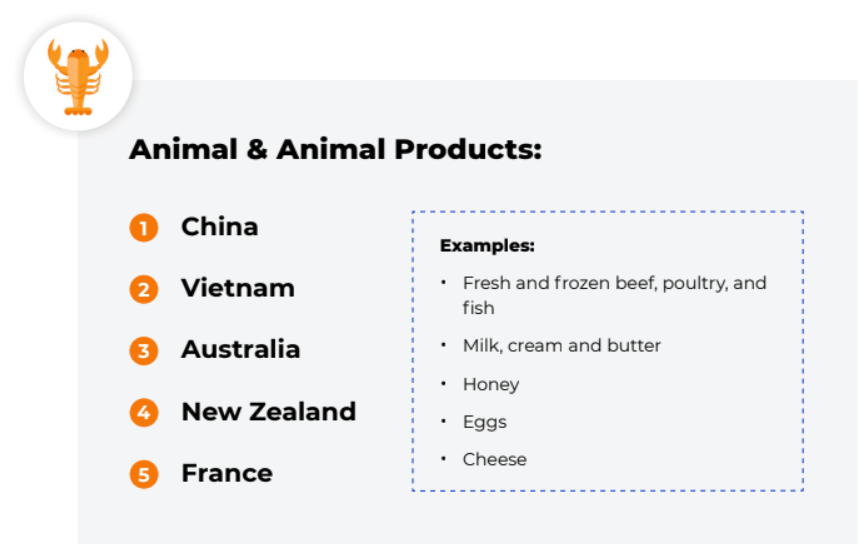
- 2% of all U.S. imports
- Product examples: honey, cheese, and milk
- Top importers: China, Australia, New Zealand, France, and Vietnam
15. Raw Hides, Skins, Leather & Furs
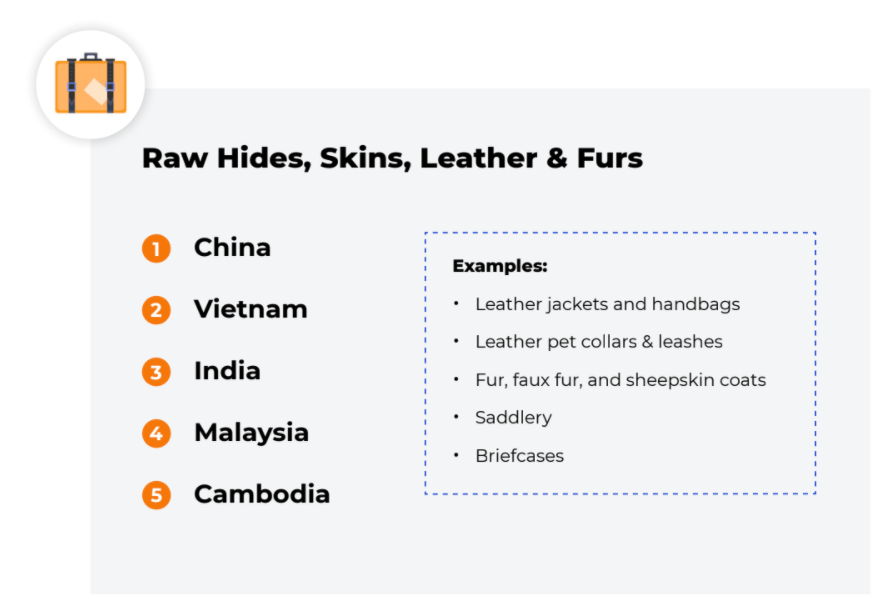
- 1% of all U.S. imports
- Product examples: Leather handbags, faux fur clothing, and briefcases
- Top importers: China, Vietnam, India, Malaysia, and Cambodia
2022 Sourcing Strategy
U.S. sellers should choose products within the top U.S. import categories, making sure to source from the countries that lead global production within the relevant import category.
You’ll still want to sell products among the top Amazon product categories in order to maximize your brand exposure and convert more sales.
![]()
There are heaps of niche products stored in every U.S.-bound freight ship, but we’re most interested in those that fall under Amazon categories that see a ton of consumer traffic. Choosing the right supplier based on global trade trends can help prevent sourcing complications and ensure that a product is made by experts in that category.
Should You Source from China? Pros and Cons of Top Global Suppliers
Why source outside of the number one U.S. importer? Let’s consider the advantages and drawbacks of working with suppliers in China versus two of its strongest competitors: Vietnam and India.
China
Pros:
- Leads production across all industries—they can and do make anything
- Generally lower production costs
- Better service and faster response times than other regional suppliers
- Quicker production process
Cons:
- Design process tends to follow templates, with less opportunity for personalization
- Higher order minimums
- Higher shipping costs
- Tariffs
Vietnam
Pros
- Lower labor costs may translate to lower production costs
- Growing in share of U.S. imports—more so than any other country
- Has different product specializations than China
- Unaffected by U.S. tariffs on Chinese goods
Cons
- Quality control may be more expensive
- Less infrastructure in banking, communications, and transport than in China
- Some suppliers don’t offer customization, so private label sellers may have to hunt for the right supplier
- Occasional worker strikes pause production
India
Pros
- A leader in natural materials like artisan wood, textiles, and metals
- Commercial laws based on British common law, so it’s similar to the U.S. legal system
- International banks tend to have branches in India
- Not subject to U.S. tariffs on Chinese goods
Cons
- Sourcing synthetic fabrics can be more expensive than in China
For more in-depth spotlights on China, Vietnam, and India’s unique trade profiles, check out our Global Imports Report for 2021.
Find a Supplier Today
With countries from nearly every geographic region represented within the top U.S. import categories, sellers shouldn’t feel limited when choosing a supplier.
For step-by-step instructions on how to source a product using Supplier Database, check out our How to Sell on Amazon guide.
8 comments on “China, India, Vietnam? Where to Source Products to Sell Online”