
 No Comments


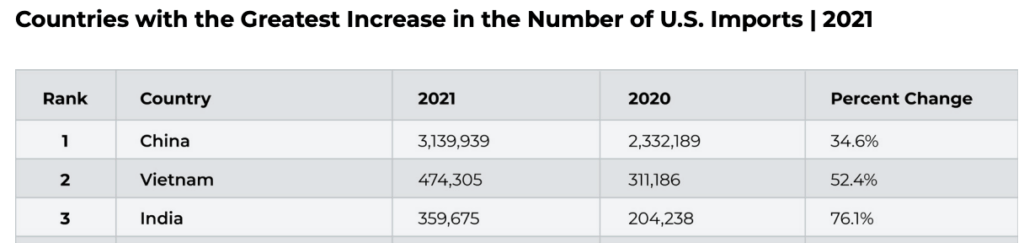
China is still the U.S.’s dominant trade partner by a significant margin, both in Asia and the rest of the world. However, its two neighbors, India and Vietnam, are growing the fastest in terms of their proportional claim on total U.S. maritime imports.
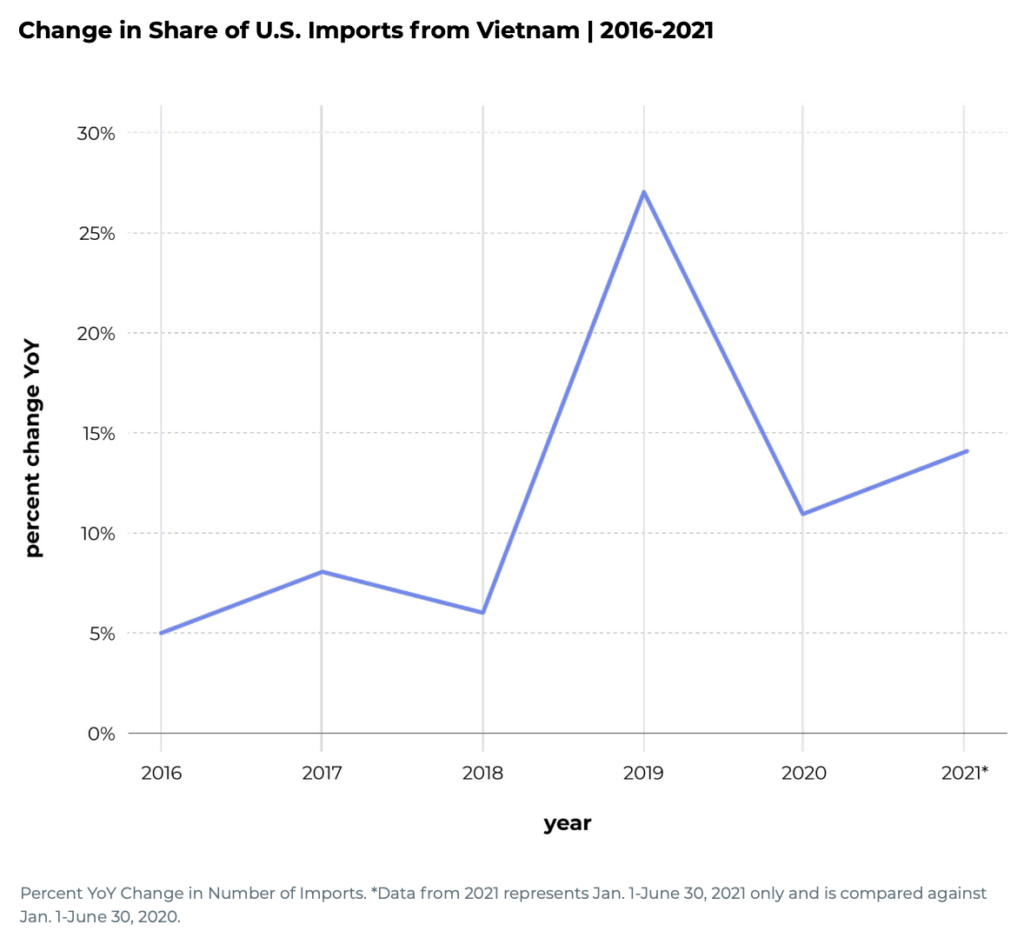
In fact, Vietnam has increased its share of U.S. imports by 88.3% since 2015 — the largest shift among the top 10 suppliers of imported U.S. goods. Additionally, the number of shipments from Vietnam to the U.S. has increased 52% in the past year alone.
What does the U.S. import from Vietnam, how has U.S. trade with Vietnam changed over time, and what role has COVID-19 played in this relationship? Let’s dive into the data from Jungle Scout’s 2021 Global Imports Report.
What products does the U.S. import from Vietnam?
In the first half of 2021, Vietnam accounted for 6.3% of all U.S. maritime imports, having sent a total of 474,305 imports to U.S. ports from January to June.
As the U.S.’s second-largest maritime trade partner, Vietnam sends a wide variety of goods to America, from furniture to food.
Import Category
Percent of U.S. imports from Vietnam
Miscellaneous
31%
Textiles
17%
Machinery / Electrical
12%
Footwear / Headgear
6%
Metals
6%
Chemicals & Allied Industries
5%
Plastics / Rubbers
5%
Stone / Glass
5%
Vegetable Products
3%
Wood & Wood Products
3%
Foodstuffs
3%
Raw Hides, Skins, Leather, & Furs
2%
Transportation
2%
Animal & Animal Products
2%
Mineral Products
1%
In 2021, most of these goods are categorized as Miscellaneous, Textiles, or Machinery & Electrical. These are each broad categories that include many staple products sold on Amazon. Using Jungle Scout’s Supplier Database tool, we can nail down which Vietnamese suppliers manufacture popular products listed on The Everything Store.
Miscellaneous
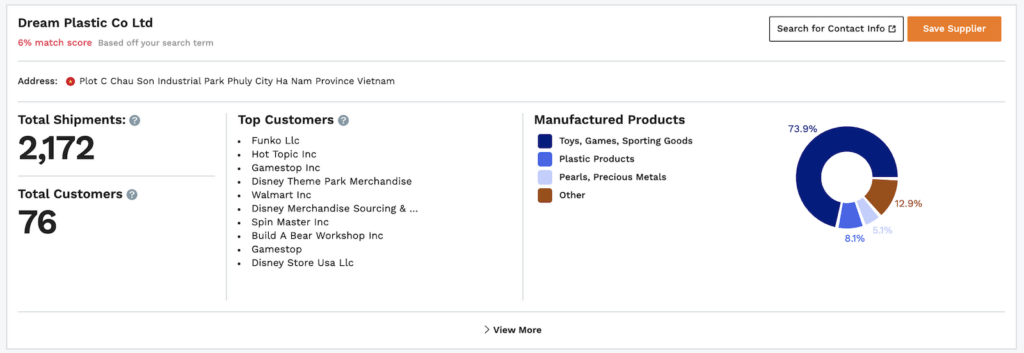
Nearly one-third (31%) of every U.S. import from Vietnam is categorized as Miscellaneous. This category includes a wide variety of products, like furniture, toys and games, musical instruments, art, and arms and ammunition.
A perennial favorite on Amazon, Funko Pop! figurines are manufactured in Vietnam’s Ha Nam Province.

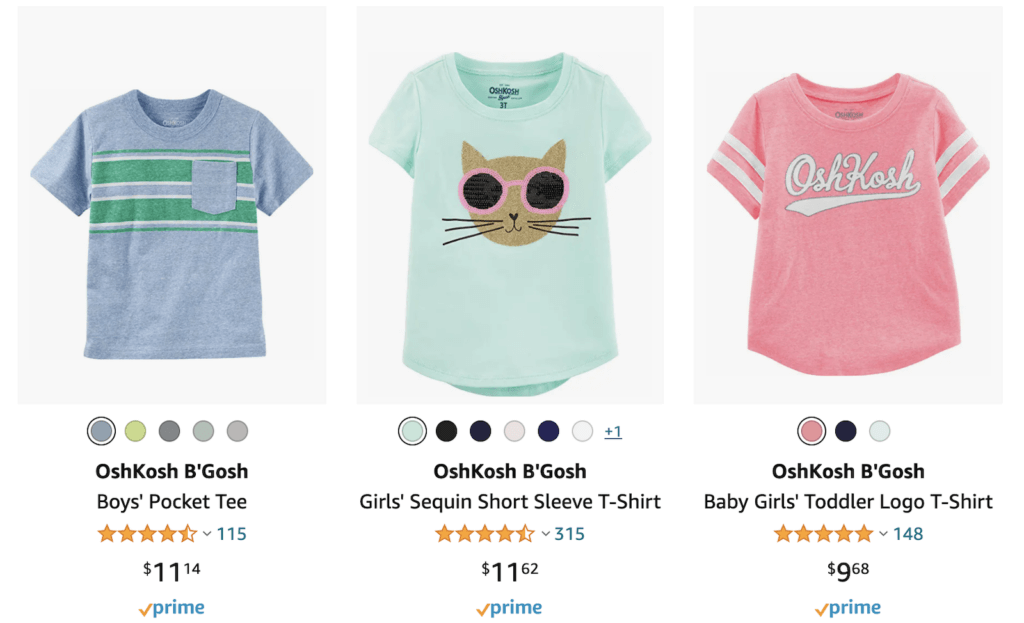
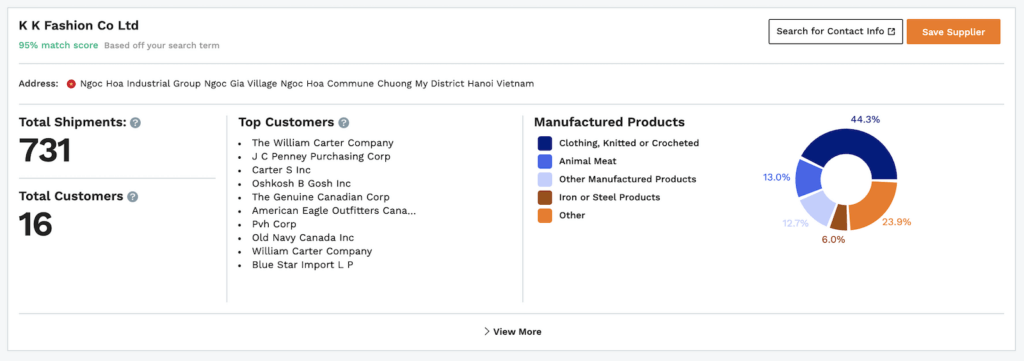
Textiles
Roughly 17% of all U.S.-bound imports from Vietnam are textiles, which includes fabric, carpets, yarn, apparel, and bedding.
On Amazon, you can find clothing made in Vietnam from OshKosh B’Gosh, which sources its kids’ t-shirts from a manufacturer in Hanoi.
Machinery & Electrical
Another 12% of U.S. imports from Vietnam are categorized under Machinery & Electrical, which includes digital devices like smartphones and calculators, industrial machinery, electric motors, home appliances, and lamps.
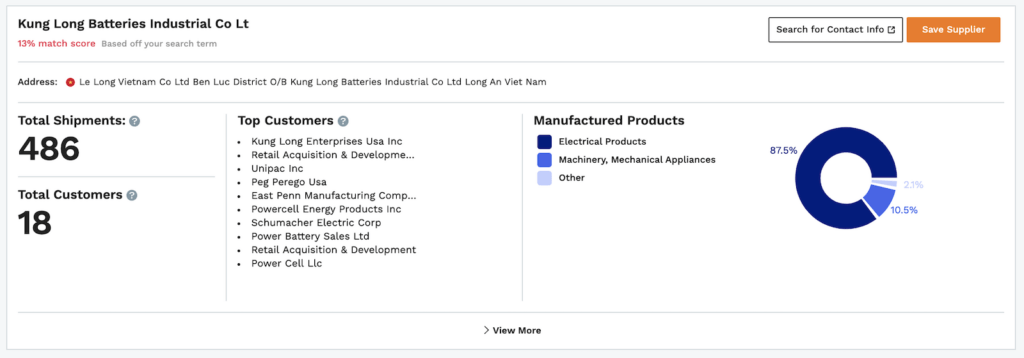
Schumacher Electric Corporation lists its automotive battery chargers on Amazon. It sources its products from Long An Province in Vietnam.

Vietnam’s trade with the U.S. over time
In the past six years, Vietnam has steadily increased the amount of goods it sends to U.S. ports. Its share of total U.S. imports has also risen by 88.3%; along the way, it has displaced Taiwan, India, South Korea, and Germany to reach its rank as the U.S.’s second-largest maritime trade partner.
Vietnam’s shipments to the U.S. show month-over-month increases from 2020 to 2021
Compared to the first six months of 2020, Vietnam has dramatically increased its volume of shipments to the U.S. In May alone, the number of imports the U.S. received from Vietnam more than doubled.
U.S. Imports from Vietnam
2020
2021
YoY Growth
January
64,508
83,541
30%
February
51,940
69,012
33%
March
51,643
89,454
73%
April
53,881
78,189
45%
May
41,195
87,441
112%
June
44,054
62,210
41%
Total H1
307,221
469,847
53%
Overall, Vietnam’s share of total U.S. imports for the first half of 2021 is up 14% over the same period last year.
Vietnam vs. China and India
The amount of goods the U.S. imports from Vietnam is roughly one-seventh of what it imports from China. In 2021, China accounts for 41.5% of all U.S. maritime imports, or over 3.1 million shipments. However, where Vietnam’s share of U.S. imports has skyrocketed since 2015, China’s share has hovered around the same level (roughly two-fifths of all U.S. imports) for the past six years, and is actually lower in 2021 than it was in 2020.
Similarly, India’s share of U.S. imports has held steady since 2015 — though it is much smaller than China’s. From 2015 to 2019, India’s share rose from 3.7% to 4.3%, and dropped back to 3.9% in 2020. The U.S. has sourced 359,675 imports from India this year, which is about three-quarters of what it has sourced from Vietnam.
Vietnam, India, and China contribute the bulk of their U.S.-bound goods within similar categories: Machinery & Electrical, Metals, Textiles, and Miscellaneous (which includes furniture, medical supplies, and toys and games).
| Top Product Categories by Country | #1 | #2 | #3 |
| China | Machinery & Electrical – 24.2% | Miscellaneous – 18.7% | Metals – 10.1% |
| Vietnam | Miscellaneous – 31% | Textiles – 17.2% | Machinery & Electrical – 11.5% |
| India | Textiles – 23.1% | Metals – 11.5% | Machinery & Electrical – 11.3% |
Vietnam and India both have strong Textiles industries; each accounts for about 10.7% of total U.S. textile imports. By comparison, China is responsible for 33% of all U.S. textile imports, though textiles are not one of its top three production categories. This speaks to the immense volume of goods China sends to America versus all other countries.
Vietnam and India are outpacing China in growth of U.S. imports in 2021
Overseas trade between the U.S. and China, Vietnam, and India was impacted by the onset of the COVID-19 pandemic, which caused manufacturing slowdowns and reductions in import volume. That said, all three countries saw positive year-over-year growth in U.S. import volume during the first half of 2021, indicating trade recovery in each region.
Vietnam and India haven’t yet come close to the amount of goods China sends to the U.S., but they are growing the fastest in terms of U.S. import volume.
India’s trade with the U.S. shows progress despite COVID
This year, India is growing the fastest in terms of its import volume to the U.S. It has also shown month-to-month progress in U.S.-bound shipments — like Vietnam, it saw impressive growth in May, sending 395% more goods to the U.S. than in May 2020.
India’s promising recovery follows its disastrous bout with COVID-19 last year, during which its year-over-year trade volume with the U.S. plummeted by 24% for the period of January to June.
India’s increase in number of imports (up 76% from H1 2020)
- January: Up 34.7% year-over-year
- February: Up 33.9% year-over-year
- March: Up 42.8% year-over-year
- April: Up 82.0% year-over-year
- May: Up 394.8% year-over-year
- June: Up 114.0% year-over-year
India has jumped up 32% in its share of U.S. imports, from 3.9% in 2020 to 4.8% in 2021.
China’s trade recovered quickly from pandemic-related issues
China, on the other hand, recovered from the pandemic quickly, regaining year-over-year growth in U.S. import volume in April of 2020 following a dramatic dip. This year, it continues to ship more goods to the U.S. each month versus last year, though its growth is slower than that of India or Vietnam.
China’s changes in number of imports (up 34.6% from H1 2020)
- January: Up 32.8% year-over-year
- February: Up 93.3% year-over-year
- March: Up 236.5% year-over-year
- April: Down 0.3% year-over-year
- May: Up 21.1% year-over-year
- June: Up 56.0% year-over-year
However, China’s share of total U.S. imports is tracking lower this year than in 2020: so far, it accounts for 41.5%, versus last year’s 43.4%.
Projections for U.S. imports from Vietnam
Barring further supply chain disruptions as a result of the COVID-19 pandemic, Vietnam’s trade with the U.S. could grow even more by the end of 2021.
Total U.S. imports are projected to top 16 million by the end of the year. If Vietnam maintains its 6.3% share of this total, it would round out 2021 with over 1 million imports to the U.S. — 1,011,092, to be exact. This would amount to a 35% increase over its 2020 total, and would set a record for U.S. imports from Vietnam.
Due to the unprecedented nature of the COVID-19 pandemic, it’s difficult to be certain about how U.S. trade will function for the remainder of the year. Another new variant of the virus could initiate global lockdowns, delays in shipping, and cause even more congestion at American ports.
But growing demand for globally sourced products in the U.S., as well as the 33% year-over-year growth in total shipments for the first half of 2021 indicates that trade is on track to grow.
For more on U.S. trade with Vietnam and other global supply leaders, check out the 2021 Global Imports Report.