 No Comments


The final quarter of 2023 is just around the bend, and for ecommerce brands and retailers, that means the start of the busiest shopping season of the year.
It won’t be long before consumers turn their attention to holiday prep and shopping. In fact, many already have: Jungle Scout Consumer Trends data shows that 27% of consumers started holiday shopping before September, and another 28% will start before the end of October.
During the holiday season, lots of time is spent in the kitchen, from baking cookies to playing host to family and friends. The extra time spent around the table also means extra sales for a range of kitchen products. Plus, many kitchen products – from nifty appliances to cookware sets – are popular gifts, giving sales an extra boost from October through December.
Which kitchen products will see the biggest sales spikes on Amazon this holiday season, and which brands are likely to lead? To find out, we’re using Jungle Scout Cobalt data to look back on Q4 2022 sales trends. We’ll dish out insights to help brands and retailers stay ahead of the holiday curve as we bid adieu to 2023.
Let’s get cooking!
Popular Holiday Season Kitchen Products
Amazon’s kitchen category is broad in scope, but let’s zoom in on sub-categories that are especially popular with holiday-season shoppers. How did these sub-categories perform last year, and which brands and products are likely to lead this year?
Cookware
There are many timeless traditions during the holiday season, and some of the best revolve around cooking up something delicious in the kitchen – which makes cookware one of the categories that sees a sales bump in the last quarter of the year.
From Q3 to Q4 2022, cookware sales on Amazon sizzled with a 33% boost, leading to a 53% increase in revenue quarter-over-quarter (QoQ).
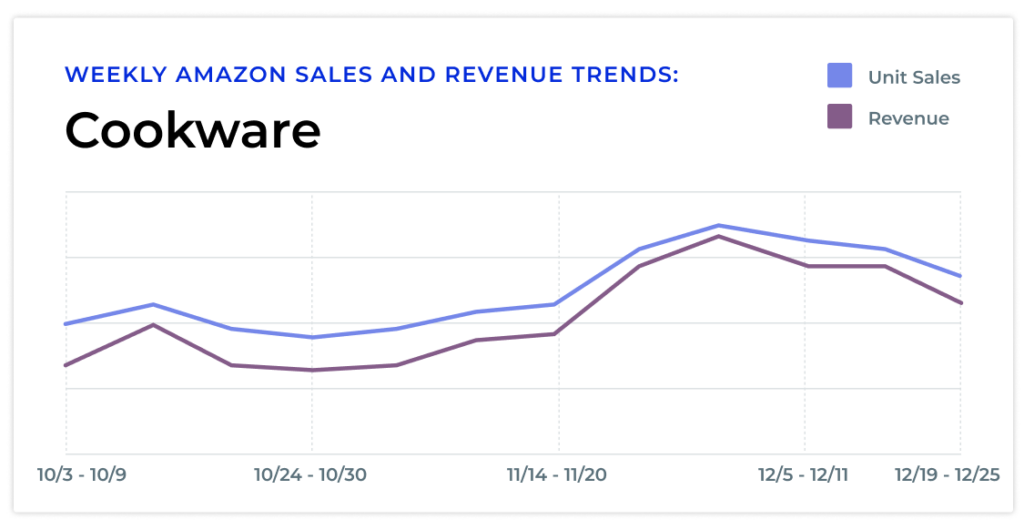
Among the most popular types of holiday season cookware are roasting pans, saucepans, and skillets. Here’s a look at how they did during last year’s holiday rush:
Roasting Pans
| Unit Sales, Q4 2022 | Revenue, Q4 2022 |
| Up 182% QoQ | Up 202% QoQ |
Top Roasting Pan Brands by Market Share
Cobalt data shows plenty of market share movement for roasting pans during last year’s holiday season, with brands like All-Clad and Circulon gaining more than 175% market share quarter-over-quarter.
| Market Share Leaders, Q3 2022 | Market Share Leaders, Q4 2022 |
|
|
Popular Products
Falling below the top 5 market share leaders didn’t detract from significant sales boosts for other brands, however. Here’s a snapshot of some of the most popular roasting pans in 2022:
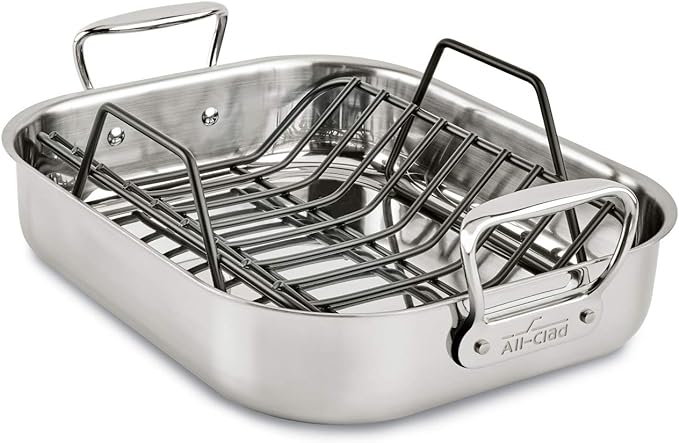
Leading the market share pack paid off for All-Clad during the holidays: Sales of this roaster increased 1,431% in the last quarter of 2022.
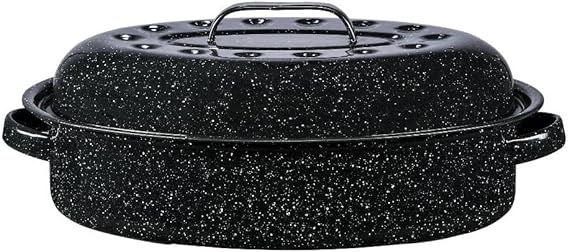
Sales of this Bovado USA roasting pan grew by 1,176% during the 2022 holiday season.
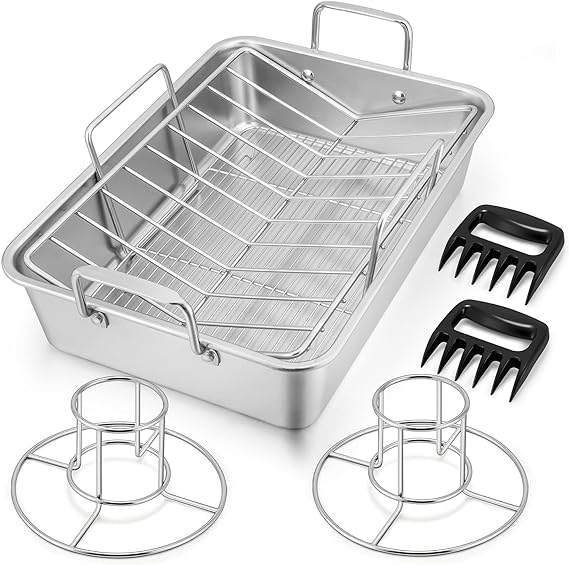
Hold onto your aprons! Sales of this P&P Chef roasting pan set grew 7,979% from Q3 to Q4 2022.
Saucepans
| Unit Sales, Q4 2022 | Revenue, Q4 2022 |
| Up 48% QoQ | Up 71% QoQ |
Top Saucepan Brands by Market Share
OXO led in quarter-to-quarter market share growth, with an impressive 314% increase. Blue Diamond was a solid second with 195% growth. Cuisinart led in market share during both quarters, growing 61% from Q3 to Q4.
| Market Share Leaders, Q3 2022 | Market Share Leaders, Q4 2022 |
|
|
Popular Products
Many brands cooked up impressive sales growth for saucepans in the final months of 2022. Here’s a closer look at some of the most popular products:
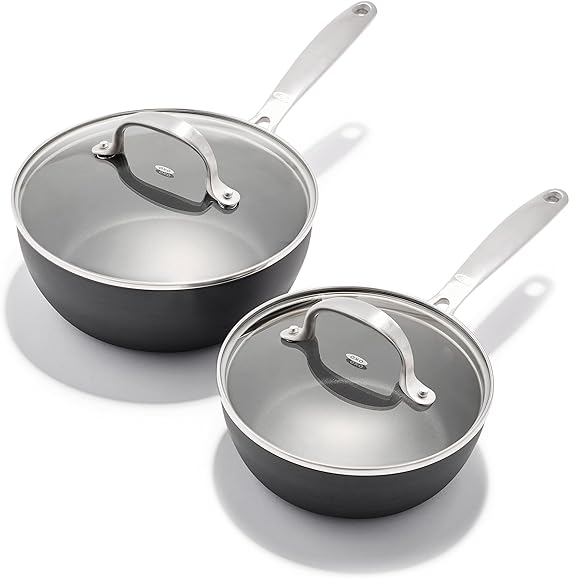
This OXO saucepan set was likely a popular gift and a helpful bundle for cooking holiday meals: Sales increased 4,971% during the season.
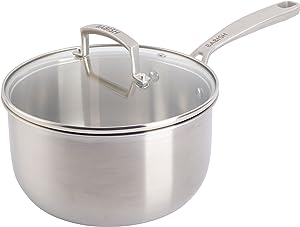
Sales of this Babish professional-grade saucepan increased by 3,135% quarter-over-quarter.
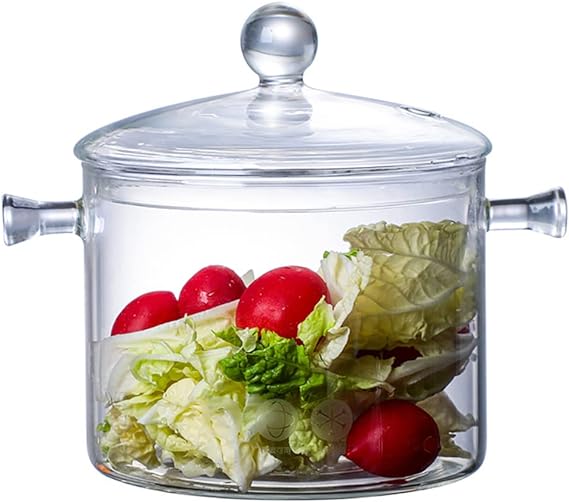
Sales of this Butige glass saucepan grew by 2,152% QoQ.
Skillets & Frying Pans
| Unit Sales, Q4 2022 | Revenue, Q4 2022 |
| Up 78% QoQ | Up 84% QoQ |
Top Skillet & Frying Pan Brands by Market Share
Among market share leaders in skillets, Cuisinart made even more significant quarter-over-quarter gains than it did in saucepans, at 116% growth. Utopia Kitchens also had sizable growth, increasing its market share by 60% in Q4.
| Market Share Leaders, Q3 2022 | Market Share Leaders, Q4 2022 |
|
|
Popular Products
Market share leaders and other brands alike saw sales spike for popular skillets during last year’s holiday shopping boom, with some products experiencing 4-figure increases. Let’s look at the data:
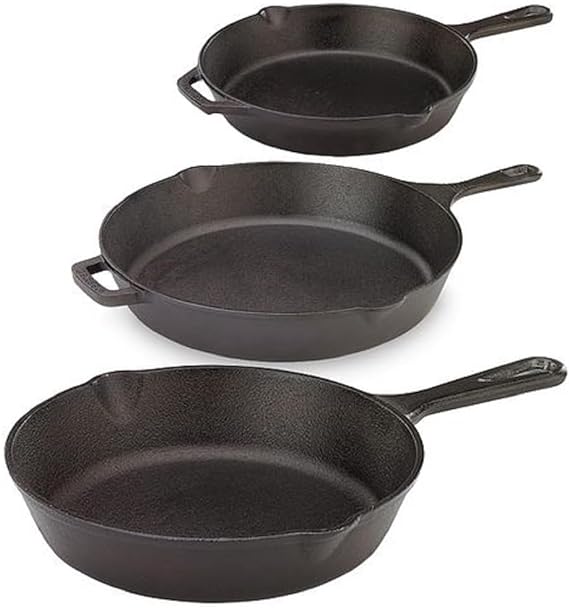
Sales of this Mercer Culinary cast iron skillet set really sizzled, with a 2,170% quarter-over-quarter increase.
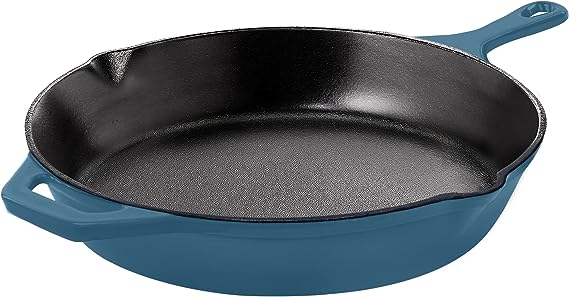
Sales of this Utopia Kitchen fry pan grew 337% during last year’s holiday season.
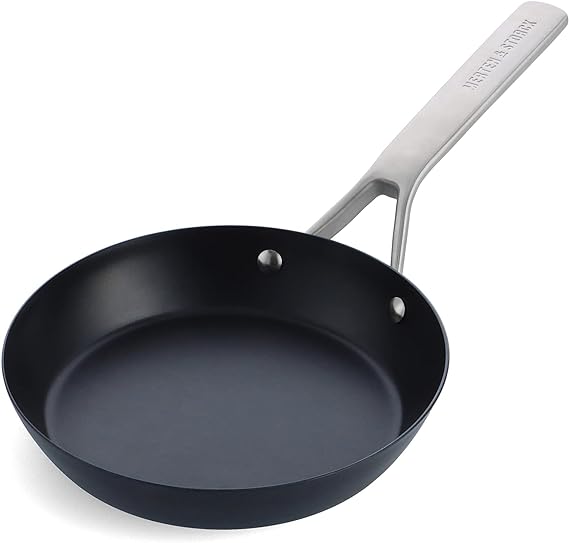
This Merten & Storck pre-seasoned frying pan saw sales jump 342% from Q3 to Q4.
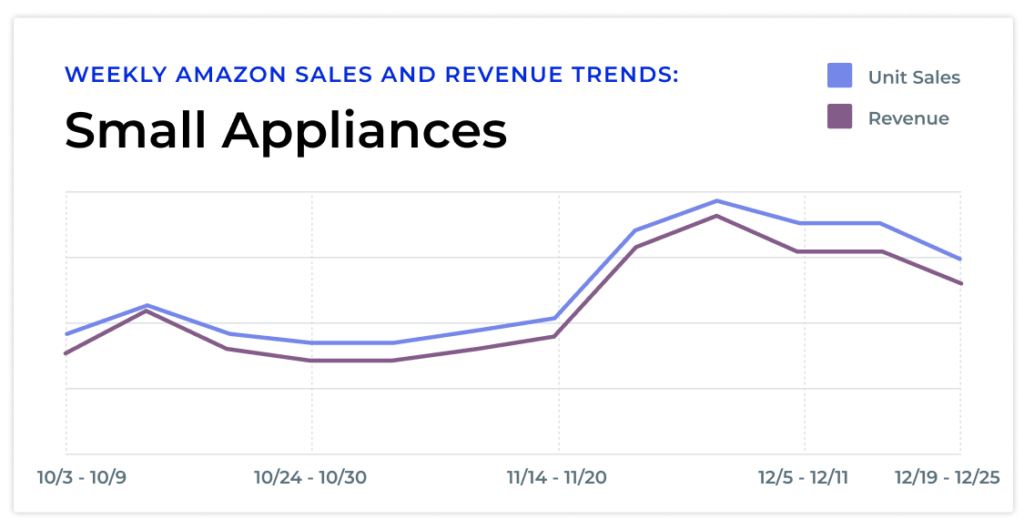
Small appliances
The right appliance makes life in the kitchen much easier, especially when many consumers are hosting big gatherings. Many small appliances saw sales gains during last year’s holiday season. Overall, sales of small appliances grew 41% in Q4, and revenue was up 39% quarter-over-quarter.
Some small appliances, like slow cookers, food processors, and coffee makers, double as popular gifts and helpful holiday kitchen tools. Let’s explore data on how these products did last year:
Slow cookers
| Unit Sales, Q4 2022 | Revenue, Q4 2022 |
| Up 49% QoQ | Up 74% QoQ |
Top Slow Cooker Brands by Market Share
Unlike some other product types, market share leaders remained largely steady from Q3 to Q4, 2022 for slow cookers. West Bend, Instant Pot, and Crock-Pot retained their position from quarter to quarter. Elite Gourmet grew its market share by 119%, pulling into the top 5 market share leaders during the holidays.
| Market Share Leaders, Q3 2022 | Market Share Leaders, Q4 2022 |
|
|
Popular Products
Sales of many slow cookers and related products skyrocketed from October – December of last year – including one popular accessory that has managed to capture truly impressive market share in this niche:
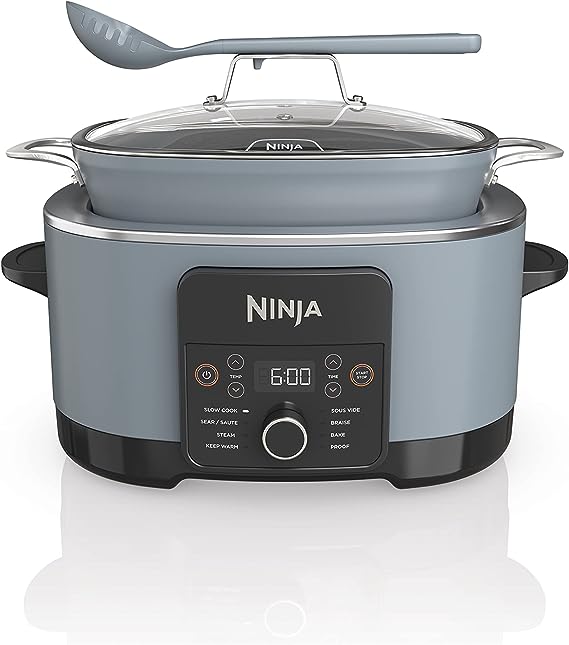
Sales of this Ninja Foodi multi-cooker show that versatility has major appeal in the kitchen: they increased 865% in the last quarter of the year.
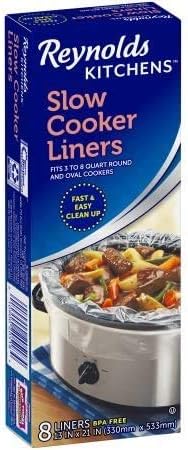
Reynold’s slow cooker liners have earned it impressive visibility in this niche. Not only was the brand among the top 5 market share leaders in Q3 2022, but sales for these liners grew 589% during the holidays.
Food Processors
| Unit Sales, Q4 2022 | Revenue, Q4 2022 |
| Up 42% QoQ | Up 42% QoQ |
Top Food Processor Brands by Market Share
The brands in the top 5 market share leaders for food processors remained the same from Q3 to Q4, though there was movement in percent share. Kitchenaid grew its market share by 73% quarter-over-quarter, putting it in the top spot during the holiday shopping season.
| Market Share Leaders, Q3 2022 | Market Share Leaders, Q4 2022 |
|
|
Popular Products
Many big-name brands saw big sales boosts for food processors as consumers prepped for holiday feasts. Here’s how a few of the most popular options fared last year:
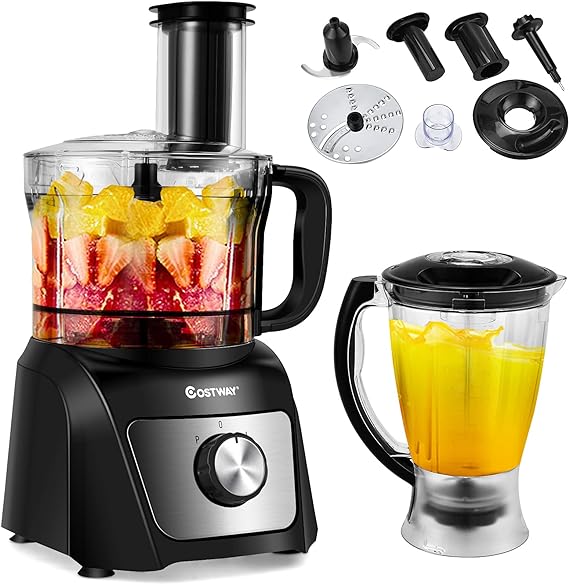
Multi-functionality fuels popularity again with this Costway food processor & blender, which increased sales by 1,306% in Q4 2022.
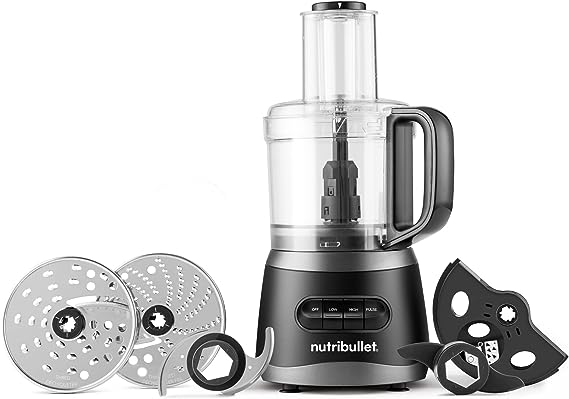
Nutribullet’s food processor made its way into a lot of holiday shopping carts last year. Sales increased 575% from Q3 to Q4.
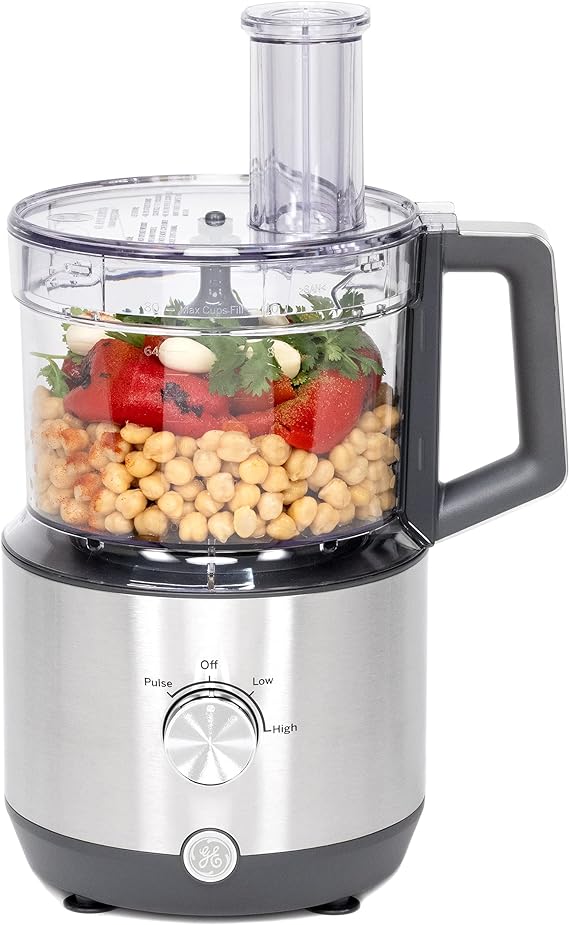
Sales of this GE food processor increased 402% quarter-over-quarter.
Coffee Makers
| Unit Sales, Q4 2022 | Revenue, Q4 2022 |
| Up 35% QoQ | Up 32% QoQ |
Top Coffee Maker Brands by Market Share
Keurig, Cuisinart, and Ninja all retained their market share position for coffee makers in Q4, while Gevi grew market share by 85% to overtake Hamilton Beach and Nespresso.
| Market Share Leaders, Q3 2022 | Market Share Leaders, Q4 2022 |
|
|
Popular Products
Big sales were brewing for coffee makers during the last quarter of 2022, with consumers fueling up for a busy closeout to the year. Brands like Bunn, Keurig, and Bialetti saw sales jump more than 1,000%:
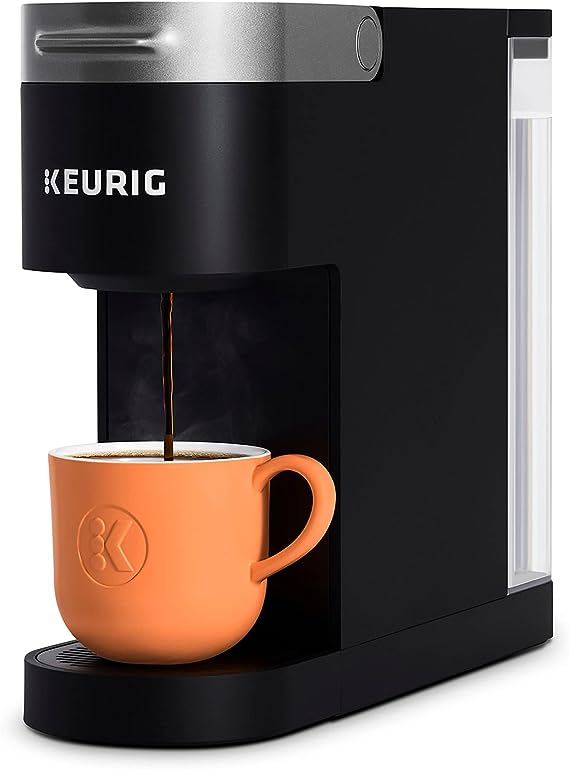
This Keurig K-Slim coffee maker heated up during the holidays, growing 1,977% quarter-over-quarter.
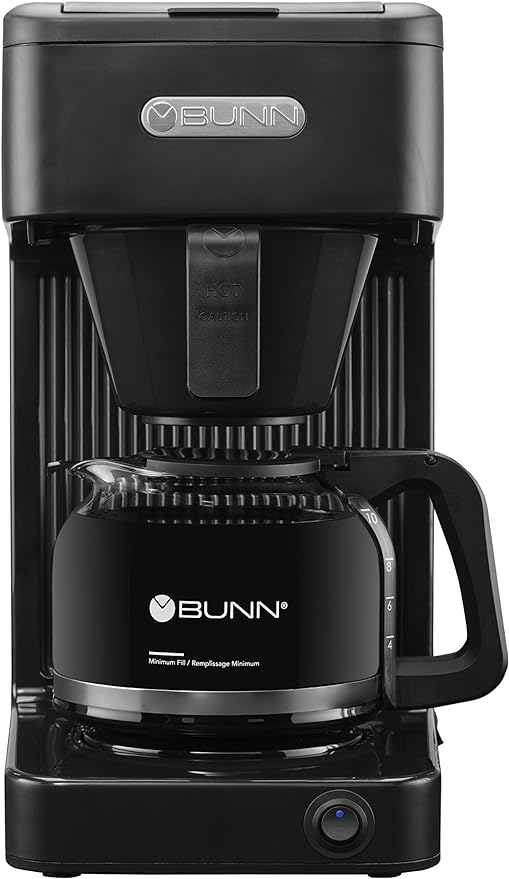
Sales of this Bunn coffee maker were percolating too, shooting up 1,096% in Q4 2022.
A lot of shoppers were looking for something a little stronger, fueling sales of this Bialetti espresso maker, which grew 1,066% from Q3 to Q4.
Utensils
Whether roasting the perfect turkey or making holiday sweets, utensils are a must for cooking and dishing out holiday foods. From Q3 to Q4 2022, Amazon sales for utensils grew 41% and revenue grew 40%.
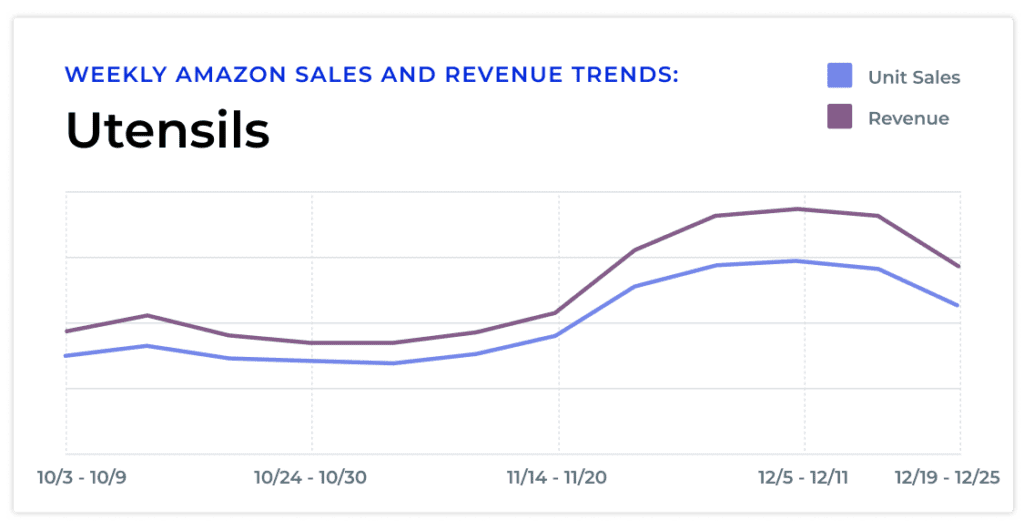
It’s no surprise that basters are one of the most in-demand kitchen utensils during Turkey Day season. Ladles and whisks are also popular during the holiday season. Here’s how each did in the last quarter of 2022:
Ladles
| Unit Sales, Q4 2022 | Revenue, Q4 2022 |
| Up 54% QoQ | Up 65% QoQ |
Top Ladle Brands by Market Share
Among leading brands, Ototo had the most significant market share growth quarter-over-quarter – a 165% that moved it into the top spot. Chef Craft and Kitchenaid also retained a spot in the top 5 during the holiday season, though Chef Craft’s market share decreased from Q3 to Q4.
| Market Share Leaders, Q3 2022 | Market Share Leaders, Q4 2022 |
|
|
Popular Products
Going up against big-name market share leaders like Kitchenaid didn’t stop other brands from building momentum throughout the season; Some brands saw sales for ladles grow more than 600%:
This iPstyle ladle and serving spoon scooped up a 629% sales increase in the last quarter of the year.
Yarlung had another popular ladle-spoon combo: Sales of this ladle and gravy spoon set grew 380% quarter over quarter.
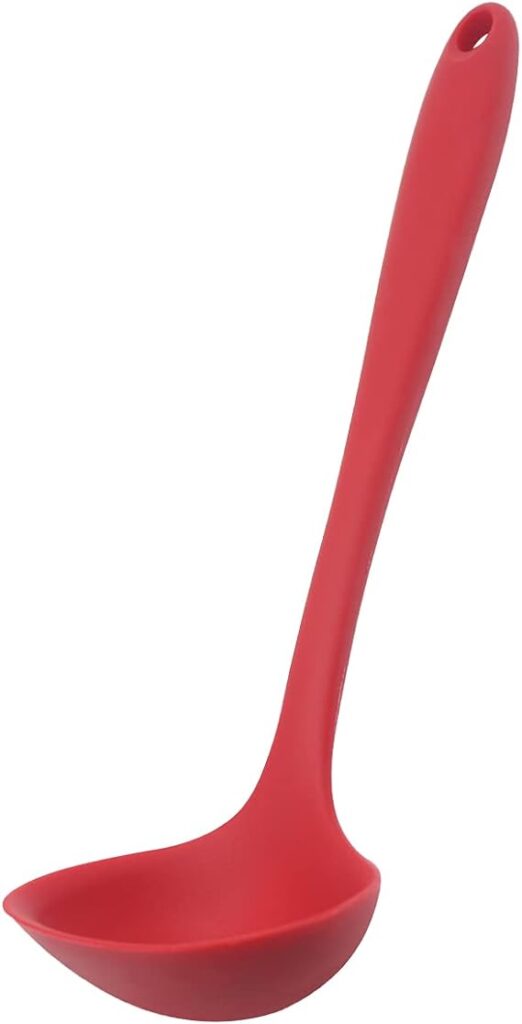
From Q3 to Q4 2022, sales of this MJIYA silicone ladle grew 294%.
Basters
| Unit Sales, Q4 2022 | Revenue, Q4 2022 |
| Up 189% QoQ | Up 272% QoQ |
Top Baster Brands by Market Share
OXO retained a commanding lead for basters from Q3 to Q4, claiming more than a third of the market share. Norpro grew 15% QoQ to stay in second, while Zulay Kitchen grew market share 26% and moved into third.
| Market Share Leaders, Q3 2022 | Market Share Leaders, Q4 2022 |
|
|
Popular Products
For many shoppers, a turkey baster is a must-have for holiday meals – so it’s no surprise that some products in this niche saw sales grow more than 2,000% in the last quarter of 2022:
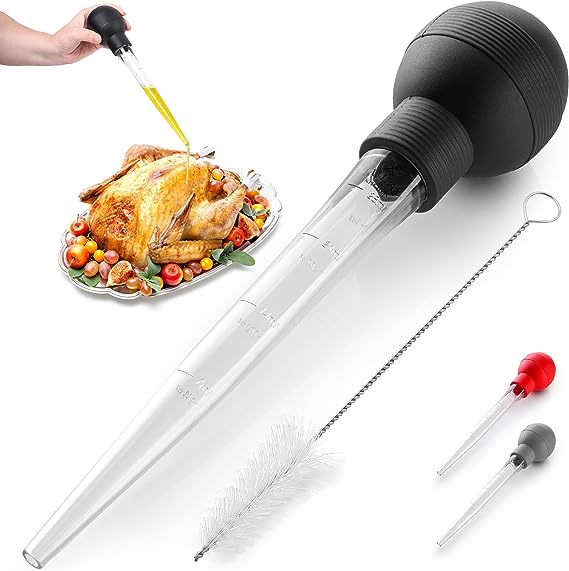
This Zulay turkey baster was the turkey-perfecting tool of choice for a lot of shoppers last year: Sales grew 2,276% from Q3 to Q4.
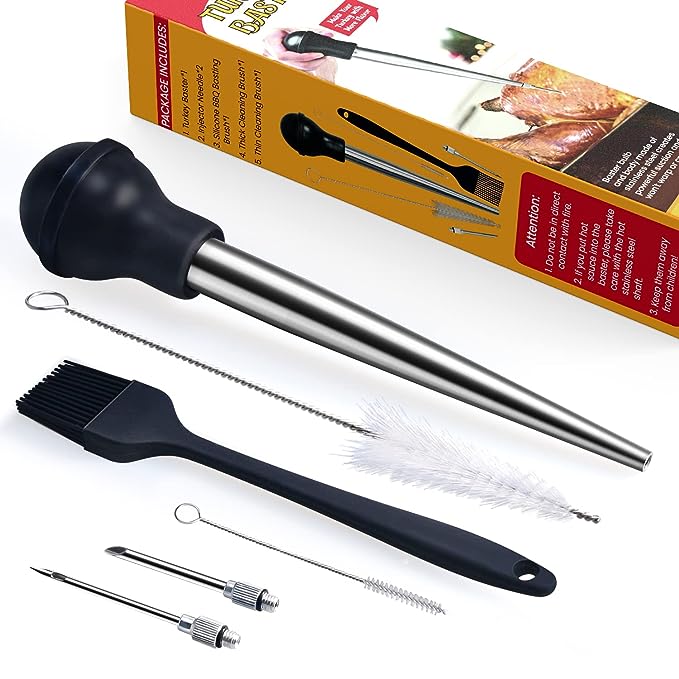
MEWMET had another popular choice for holiday chefs: Sales of this turkey baster grew 857% during the holidays.
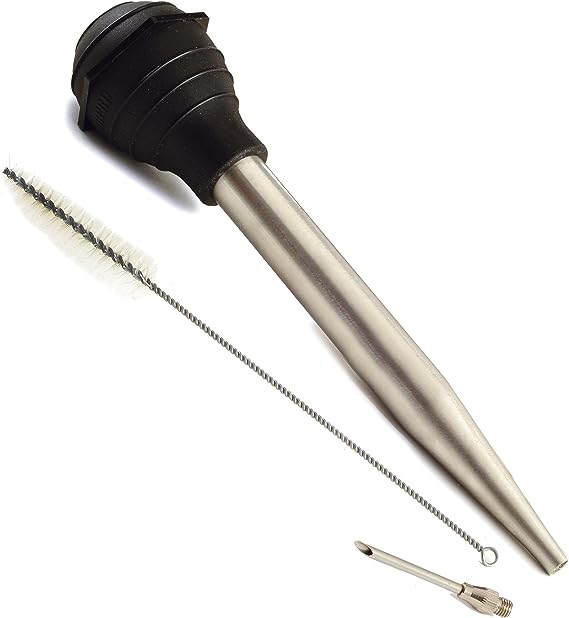
Norpro’s stainless steel baster also had impressive growth, increasing sales 724% quarter-over-quarter.
Whisks
| Unit Sales, Q4 2022 | Revenue, Q4 2022 |
| Up 55% QoQ | Up 65% QoQ |
Top Whisk Brands by Market Share
OXO made another appearance in the top market share spot for whisks, claiming 19% market share during the holidays. Whiskware and Walfos remained in second and third, respectively, while Kitchenaid was usurped by Amazon Basics and Jillmo in Q4.
| Market Share Leaders, Q3 2022 | Market Share Leaders, Q4 2022 |
|
|
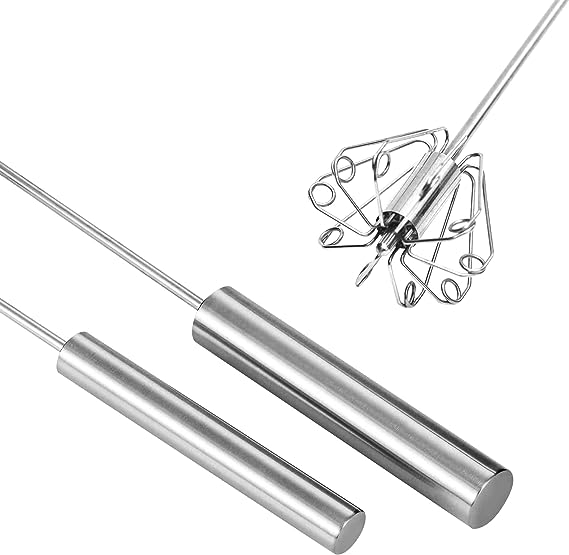
Popular Products
For a small utensil, whisks generated big sales for a lot of kitchen product brands last year. Let’s see how some of the most popular options performed:
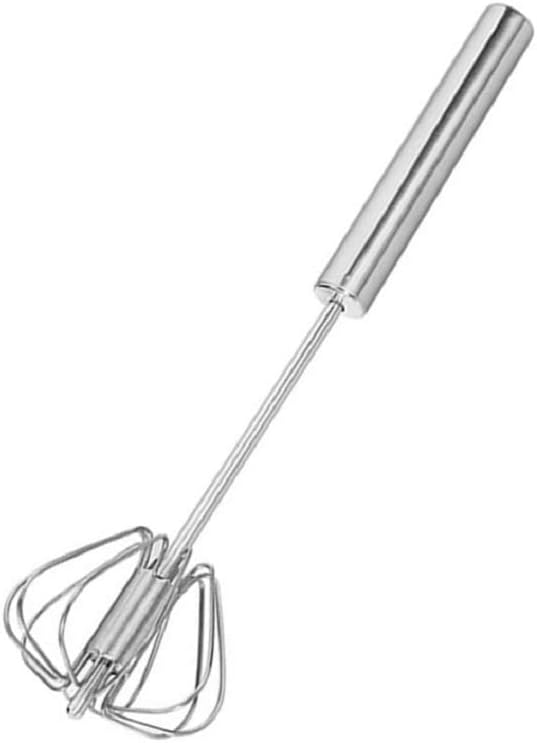
This Mykimono semi-automatic whisk whipped up its popularity with shoppers, growing sales by 958% in Q4 2022.
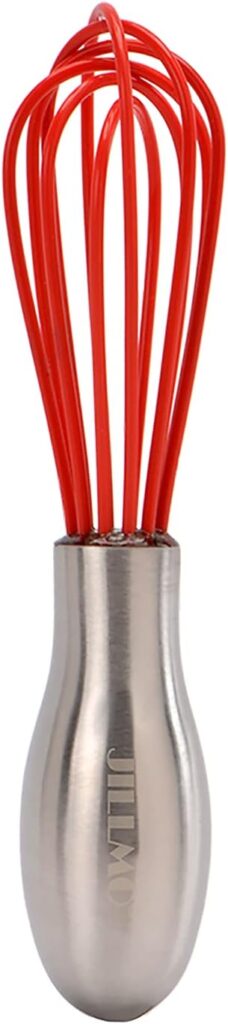
Sales of this Jillmo silicone whisk were fluffing up as well, increasing 459% quarter-over-quarter.
Cooks Innovations hand whisk saw holiday-season sales increase 414% compared to the previous quarter.
Bakeware
What’s the holiday season without pies, cookies, and other baked goods? The prominence of sweet treats in holiday feasts leads to big sales increases for products in the bakeware sub-category. From Q3 to Q4 2022, overall sales of bakeware products grew 51% and revenue increased 57%.
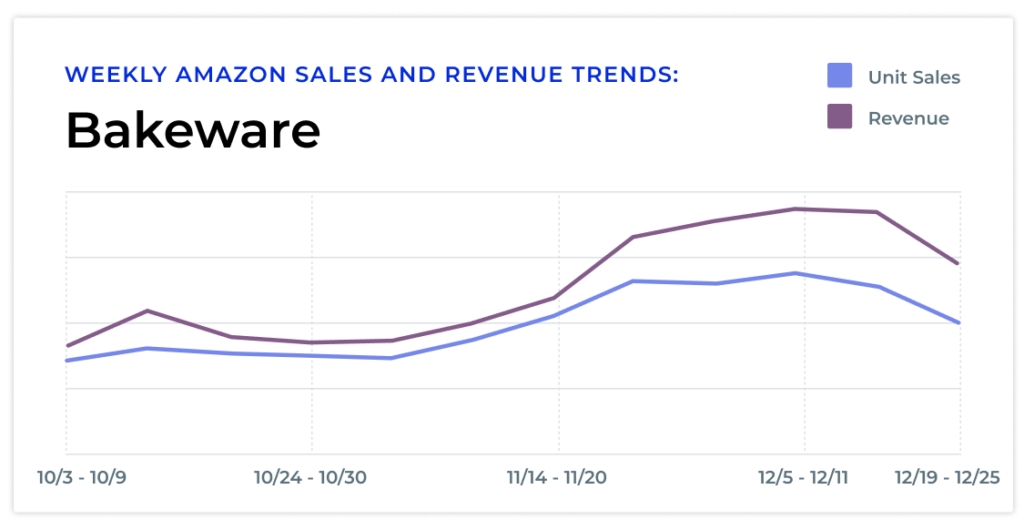
Among kitchen products, pie pans and baking sheets see some of the biggest sales spikes during the holidays. Mixers also see a big jump – likely due to both seasonal baking and gift-giving. Here’s a look at how each of these products did during holiday shopping last year:
Pie pans
| Unit Sales, Q4 2022 | Revenue, Q4 2022 |
| Up 149% QoQ | Up 128% QoQ |
Top Pie Pan Brands by Market Share
Brands Le Tauci and Furrain both had impressive market share jumps from Q3 to Q4 (183% and 88%, respectively), pushing them both into the top 5 market share leaders during the holidays. Pyrex also moved up quarter-to-quarter to take the lead in Q4.
| Market Share Leaders, Q3 2022 | Market Share Leaders, Q4 2022 |
|
|
Popular Products
Many pie pans grabbed a big slice of sales during the final quarter of the year, as shoppers prepared to fill their tables with holiday goodies. Here are some of the most popular items:
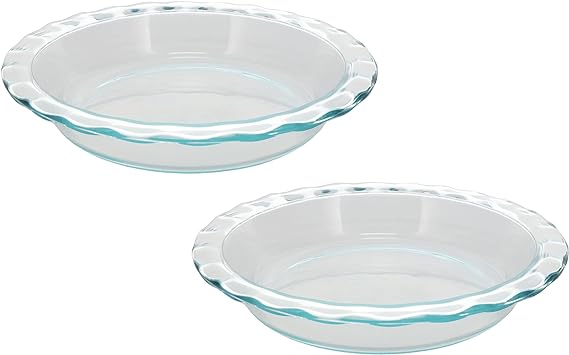
This Pyrex easy-grab pie plate took a big slice of sales in this niche, with a 1,876% quarter-over-quarter increase.
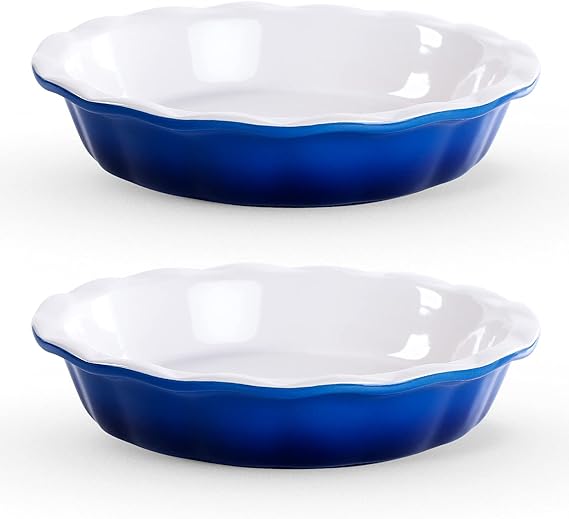
These Lareina pie pans baked up their own holiday-season success: Sales grew 966% during Q4 2022.
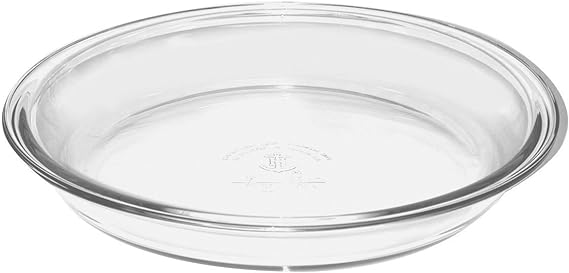
Sales of this Anchor Hocking pie plate enjoyed a sweet sales increase as well, with 675% growth from Q3 to Q4.
Baking Sheets
| Unit Sales, Q4 2022 | Revenue, Q4 2022 |
| Up 54% QoQ | Up 50% QoQ |
Top Baking Sheet Brands by Market Share
Nordic Ware was the top market share leader in both Q3 and Q4, claiming 15% market share during the holidays. USA Pan grew its market share by 65% quarter-over-quarter, overtaking Rachael Ray for a top 5 position.
| Market Share Leaders, Q3 2022 | Market Share Leaders, Q4 2022 |
|
|
Popular Products
During the holidays, baking sheets seem almost synonymous with warm cookies – but they’re also popular for roasting vegetables and other seasonal sides. This versatility may be what helped fuel sales for many products last year:
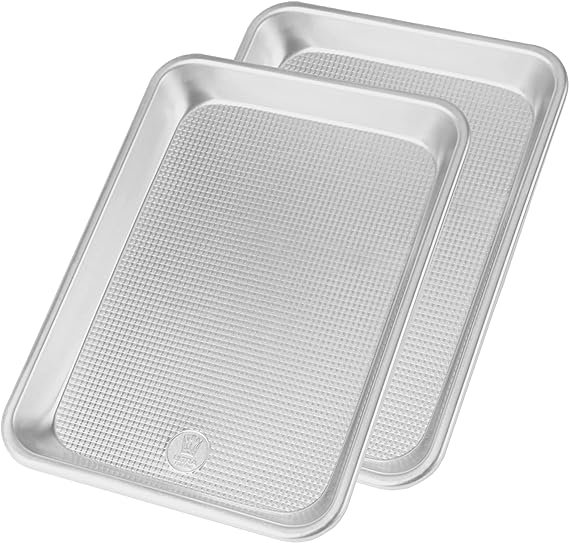
Sales of these Ultra Cuisine baking sheets warmed up during the holiday season, growing 384% quarter-over-quarter.
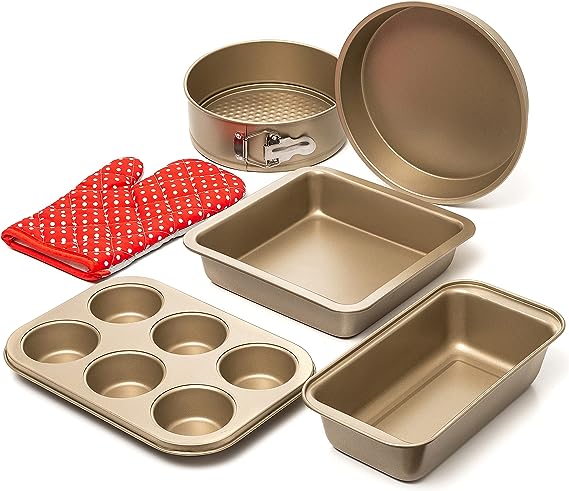
This Moss & Stone baking pan set served up a 343% QoQ sales increase.
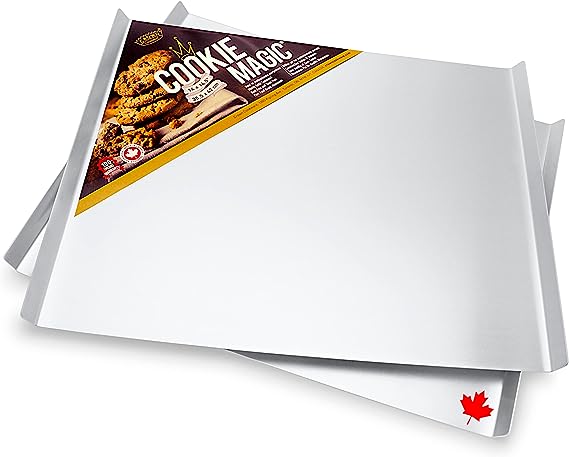
Sales of this 2-pack of Crown Cookware cookie sheets grew 247% QoQ.
Mixers
| Unit Sales, Q4 2022 | Revenue, Q4 2022 |
| Up 112% QoQ | Up 132% QoQ |
Top Mixer Brands by Market Share
KitchenAid claimed a whopping half of the market share for mixers in both Q3 and Q4 2022. Cuisinart had the highest quarter-over-quarter growth, increasing its market share by 109%.
| Market Share Leaders, Q3 2022 | Market Share Leaders, Q4 2022 |
|
|
Popular Products
The Kitchenaid stand mixer is not only a year-round staple of countless kitchens, it’s also a popular gift during the holiday season. But it’s not the only product in this niche to enjoy 4-figure sales increases in 2022:
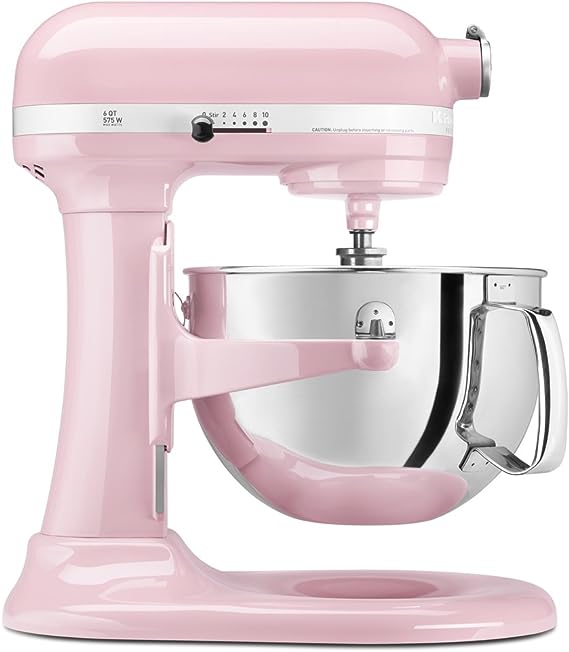
This Kitchenaid stand mixer lived up to its reputation as one of the most popular kitchen products available, growing sales 3,131% quarter-over-quarter.
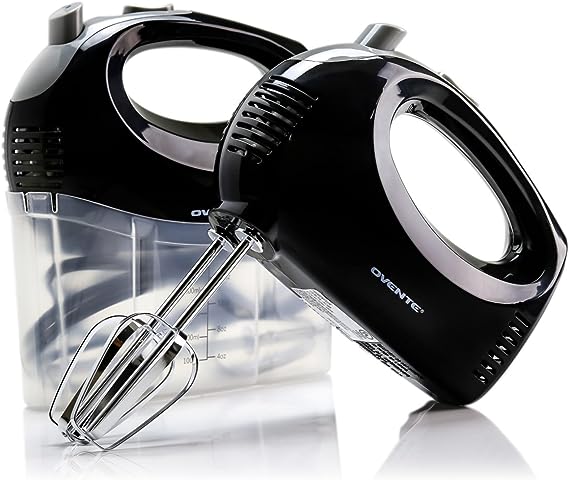
This OVENTE portable hand mixer was a clear hit too, with a 1,291% sales increase from Q3 to Q4.
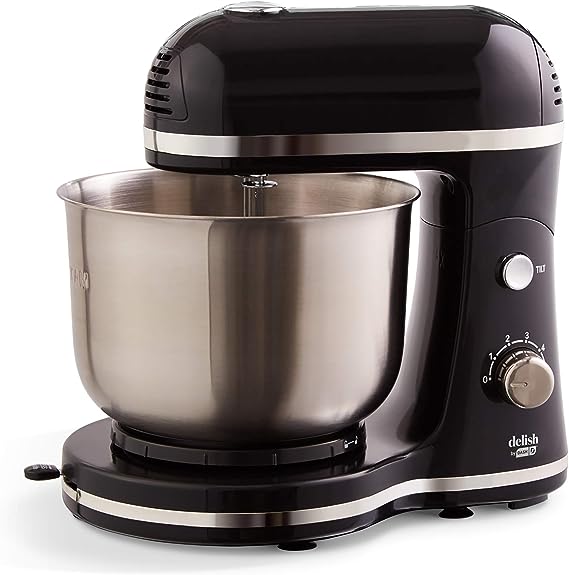
Dash’s compact stand mixer held its own, enjoying a 1,223% quarter-over-quarter sales boost.
Key Takeaways for Kitchen Brands During the 2023 Holiday Season
Reflecting back on historical data from previous years is one of the most valuable tools for building strategies for the future. This is especially true for highly competitive shopping seasons and product types that are consistently in demand from year to year.
Don’t miss our upcoming webinar on using historical data to report success and measure ROI on Amazon. Register now to save your seat for the October 4th event.
The Cobalt data we’ve explored today highlights several key takeaways that can help brands and retailers stay agile as they promote their kitchen products stay agile during this year’s holiday rush:
- Expect market share shakeups. Market share is fluid, especially as competition rises during the holiday season. As brands ramp up advertising and other efforts, the competition for market share hits a boiling point and new leaders can arise. Of the 12 product markets explored in this post, only 1 retained the same top 5 market share leaders from Q3 to Q4, 2022 – and none retained all 5 market share leaders in the same positions. That means there’s a significant opportunity to grow your market share in these and similar product niches during the holidays.
- Anticipate likely brand leaders. While market share showed a lot of movement during 2022, some brands consistently led in multiple markets, making them likely leaders in the Kitchen category this year as well. Cuisinart, for example, was a top 5 market share leader in 6 out of the 12 niches included here. Hamilton Beach and OXO led in 4 out of 12, and Kitchenaid led in 3 out of 12. At the same time, plenty of brands that didn’t hit the top 5 in market share for their niches still saw incredible sales growth for their products.
- Opportunity lasts all season long. In the sub-categories we’ve reviewed in this post, sales began ramping up in October and continued growing throughout November and December. Because many kitchen products are also popular gifts, increased sales aren’t just limited to the earliest part of the season when consumers are planning for holiday-season cooking.
Products like cookware and small appliances will be popular with gift shoppers and last-minute shoppers, too. Plus, consumers shop all the way from September right up to Christmas, so they’re on the lookout for deals and great gifts even before fall officially begins.
With these takeaways as guideposts, brands and retailers can build holiday ecommerce strategies that leverage the unique opportunities in Amazon’s kitchen products category.
More data on Amazon category trends
Amazon Market Watch: Explore more Market Watch posts where we dive into current trends impacting sales on Amazon.
Category Snapshots: See keyword and product trends, category revenue, unit sales, competing brands, and more for various Amazon categories:
About This Report
The product data in this report is representative of the U.S. Amazon market. Market insights on Amazon products were sourced from Jungle Scout Cobalt, an industry-leading market intelligence, advertising optimization, and ecommerce reporting platform powered by nearly 2 billion Amazon data points. Quarter-over-quarter comparison data reflects the period of October 1, 2022 – December 31, 2022, as compared to the period of July 1, 2022 – September 30, 2022.
We encourage you to share, reference, and publish this report’s findings with attribution to “Jungle Scout Cobalt” and a link to this page.
For more information, specific data requests, media assets, or to reach the report’s authors, please contact us at [email protected].