
 4 Comments
In today’s competitive ecommerce landscape, sellers need to get creative to make their products and listings stand out on Amazon.
You may have the best product in your niche, but if you cannot portray that to your potential customers in an engaging and informative manner, your products may not get the love they deserve.
Since customers cannot see and touch your product in person, infographics are a powerful way to enhance the shopping experience and showcase your product attractively.
In this article, we’re going to go over what infographics are, why you should use them for your Amazon listings, and how to create infographics that sell.
What is an infographic?
An infographic is a collection of images, icons, colors, and data visualization to present information clearly and effectively.
Instead of learning about a particular Amazon product by reading a big block of text, wouldn’t you rather learn about the product by looking at easy-to-understand product images? Consumers want information about a potential purchase readily. This is precisely the point of using infographics on your product detail pages.
Besides your main product image, the other six images on your listing don’t need to be of products on a pure white background. You’re allowed to use unique backgrounds, text, graphics, icons, lifestyle imagery, and so on, to convey information and add visual interest.
Instead of just using straightforward product photography, you can use the space to showcase your product’s main features and benefits. That way, customers can quickly learn about your product without being limited to reading the bullet points or description.
Let’s look at an example of a good infographic used on Amazon:
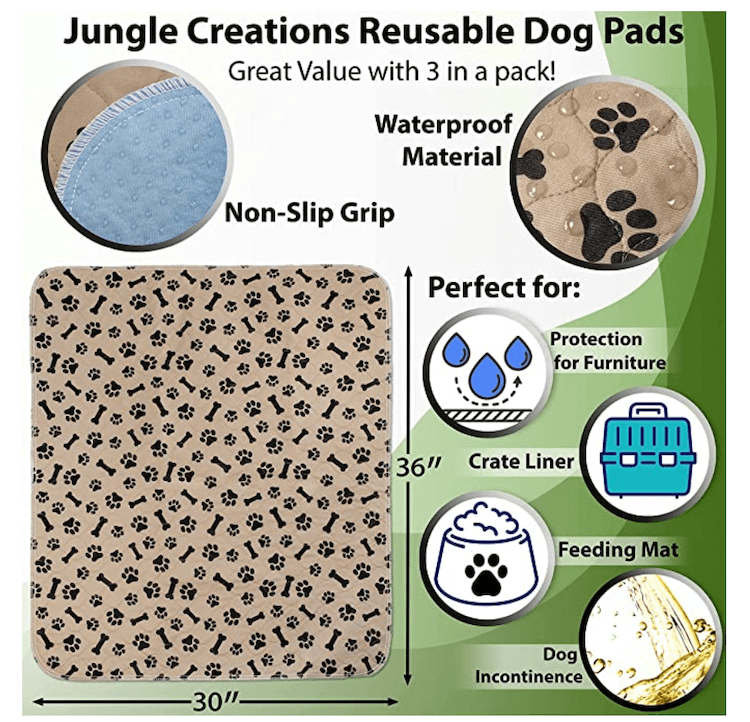
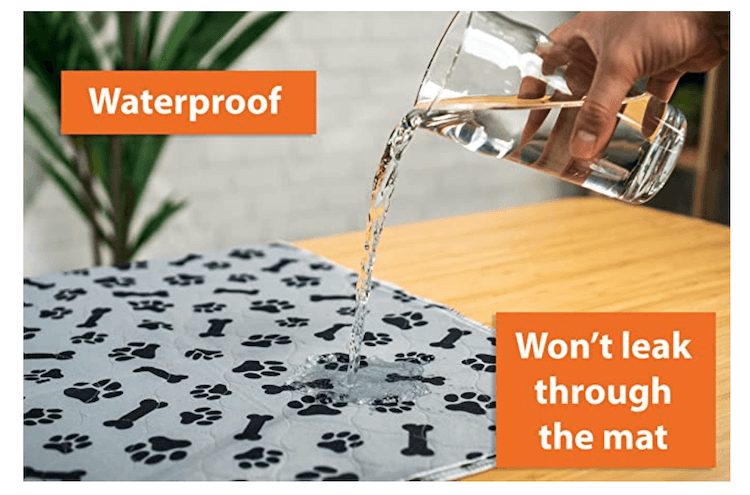
The image above is an example from the Jungle Scout Million Dollar Case Study product: Jungle Creations Washable Pee Pads for Dogs. This image includes photos of our product, bold text pointing out important features, eye-catching colors, and icons representing use cases.
This one infographic on our Amazon listing gives the potential customer helpful information without them having to rely on the description. Do you see how this infographic provides much more value versus a simple photo of the product?
Where to use infographics on Amazon
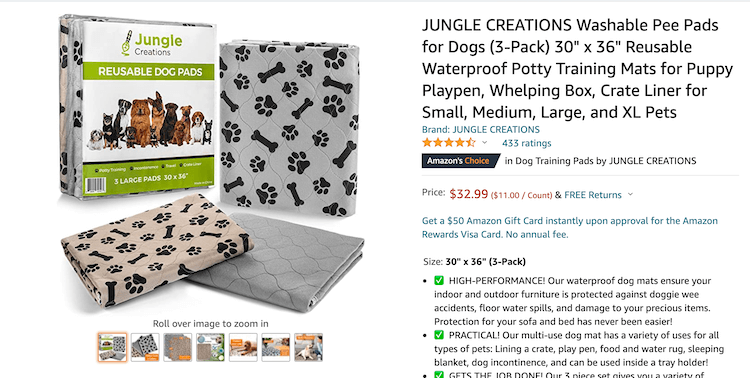
One spot to feature infographics is in the product image section on your Amazon listing. Here, you’re allowed to upload up to seven images — or six images and one video.
We recommend using all the space available to show off your product. Just one or two images for your listings may not be enough for customers to compel them to make a purchase.
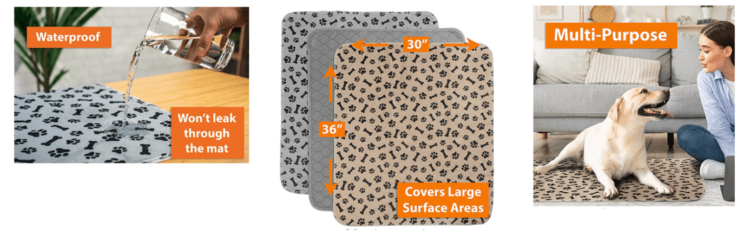
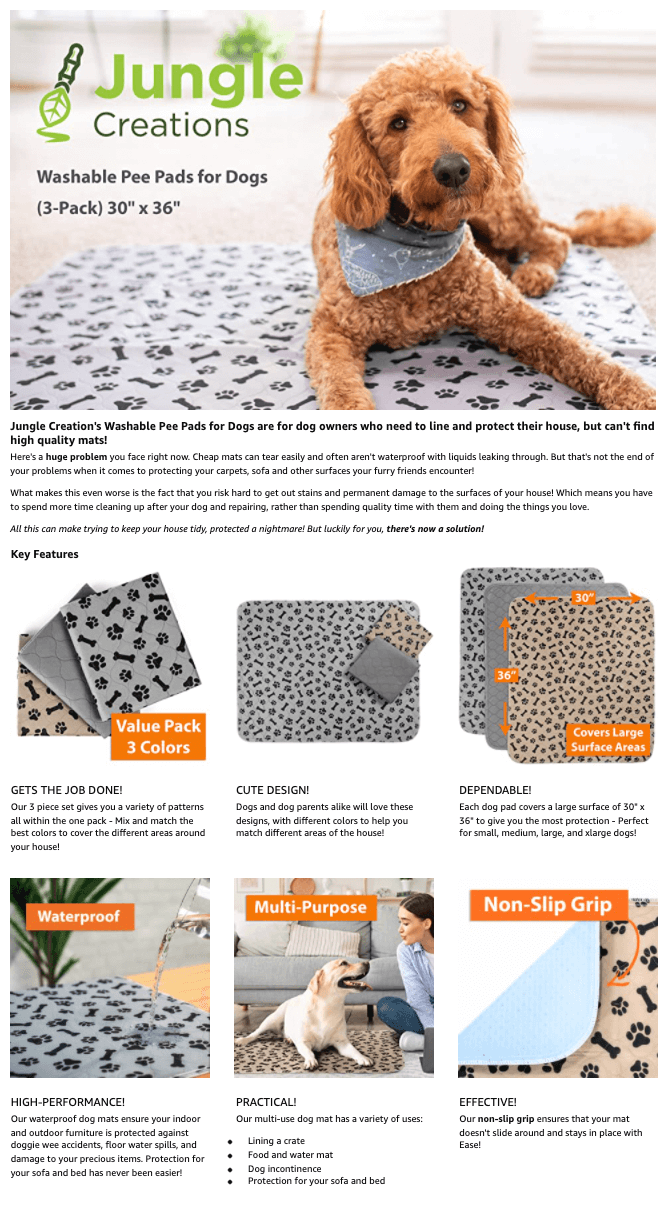
Another section to add infographics to is in your A+ Content. A+ Content appears under the product description section on an Amazon listing and allows you to add large images, infographics, and text in a unique display.
Elements of a successful infographic
The infographic that you create for your listing should be unique to your niche and have a common theme throughout your brand. An effective infographic also connects with your target audience. If you sell outdoor kids’ products, your potential customers would find value in infographics that are fun, colorful, and instructive. Your infographic could be sleeker and information-based if you’re selling electronics.
Let’s go through what makes a good infographic:
Informative
The goal of each infographic you create is to provide the customer with relevant information about your product. Learn to point out all of your product’s essential features and benefits within your infographic. This will save the customer from digging for more information throughout your bullet points and description.
Don’t cram too much information within each infographic, though. You have six additional images on your Amazon listing to use infographics and create a cadence for your product information. If you can include more than one feature without cluttering the image, then go for it. Otherwise, use each image to address your product’s main features, why that feature is important, and the problems it solves.
Attractive
A mere image of your product on a white background with some bland text can be boring. You’ve got some creative freedom to create visual interest for your listing, so make this space count!
Use colors, icons, typography, and unique branding to help the images stand out and draw attention to your product. Icons are a great way to point out your product’s special features or benefits.
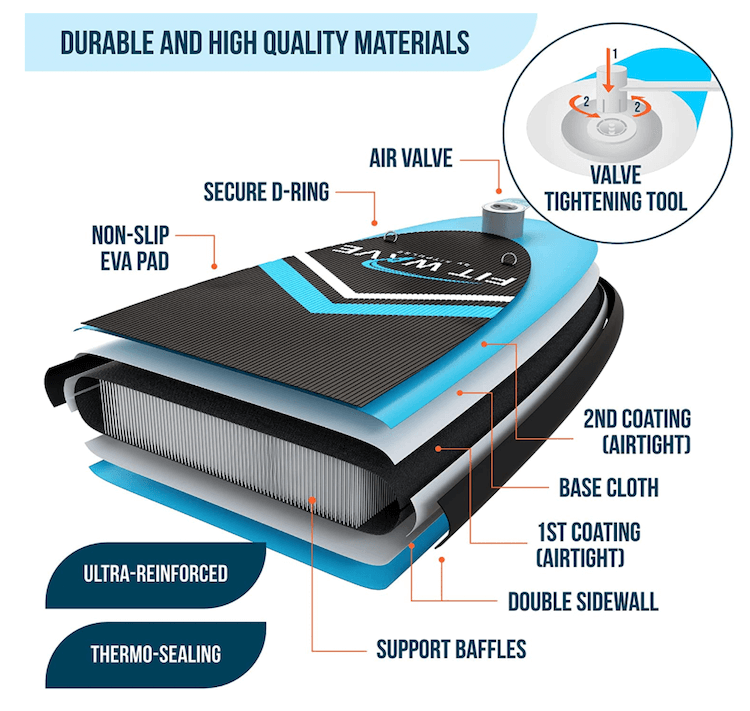
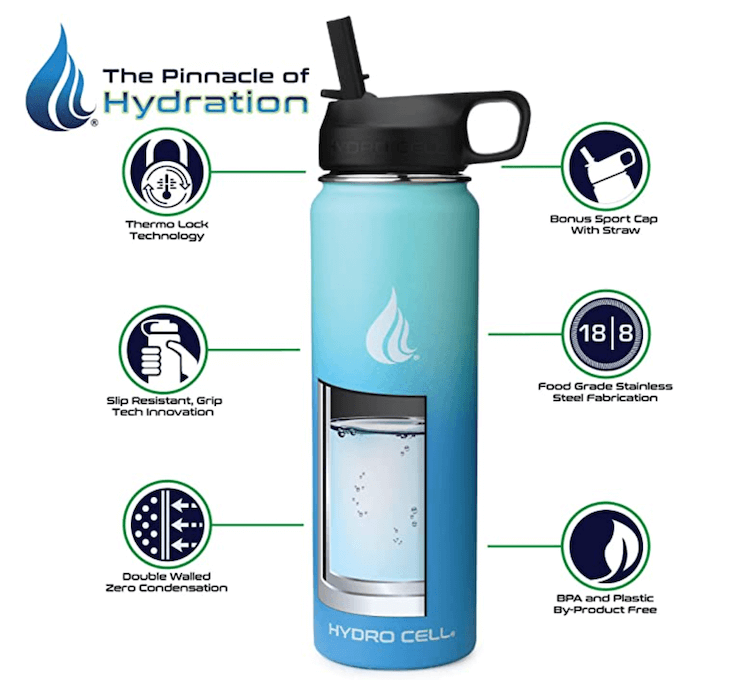
3D rendering can also differentiate your images from your competitors’. If you’re selling an intricate product — such as an inflatable paddleboard or insulated coffee cup — where you cannot physically see the features discussed, use 3D rendering to show customers the “insides” of your product.
Lifestyle backgrounds
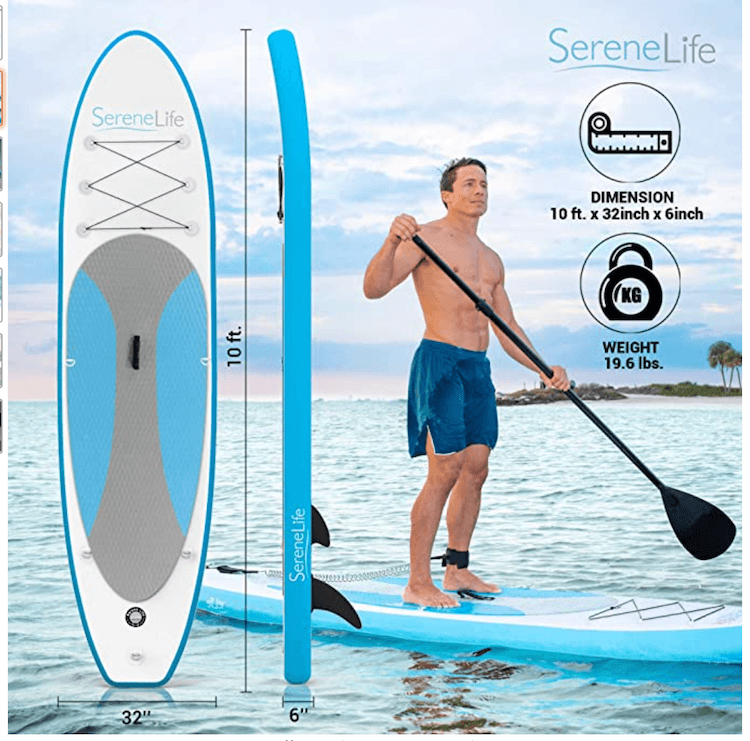
Show the product in use by incorporating lifestyle imagery in your infographic. In the paddleboard image example below, you can immediately see the product in action, with product weight and dimension information clearly displayed.
Consistent fonts
When creating multiple infographics, try to use the same fonts to keep your branding consistent. Mismatched fonts and colors may not look as professional, and the customer will likely forget your brand identity.
When choosing fonts, make sure that they represent your brand and complement your product. For example, if you are selling decorative throw pillows, you don’t want the fonts in your infographics to be action- or sports-inspired. You’ll likely choose something more elegant and stylish.
Target audience focus
Think about how your type of customer shops for a product like yours. Try to recreate that experience for them within an infographic. The customer needs to be able to picture themselves using your product from the visuals that you provide.
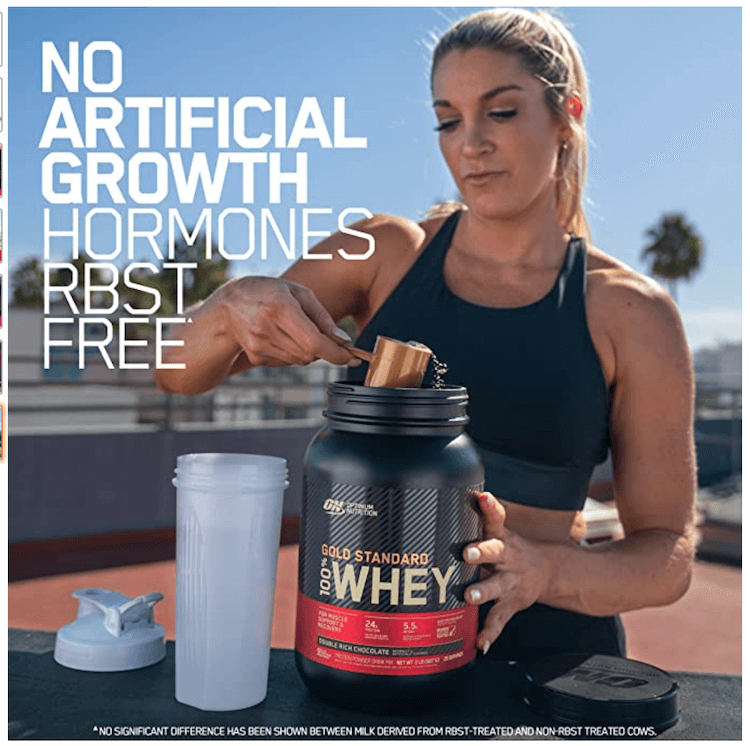
If you are selling protein powder, display the product in a fitness or gym setting that gets your customers motivated to use your product. Or, if you’re selling a travel bag, show off your product in an airport setting so the customer can picture themselves using it while traveling.
You’re not selling this product in person in a brick-and-mortar environment — the infographic is your sales pitch. By using infographics and lifestyle imagery unique to your niche, you give consumers a unique virtual experience.
How to hire freelancers to create your infographics
Now you’re probably thinking, “Well, this all sounds great, but I’m not a graphic designer.” Luckily, you don’t have to be! You can hire a professional graphic designer familiar with the Amazon marketplace to help create unique infographics you can use on your Amazon listings.
Search on freelancer websites to find reputable designers that will fit your needs:
- Fiverr.com
- Freelancer.com
- Upwork.com
If you’d like more information on hiring an Amazon assistant or freelancer, check out our “How to Hire Amazon FBA Assistants & Freelancers” guide.
Make your product stand out with infographics
We hope this guide helps you understand the importance of using infographics for your Amazon products. The competition is tough. Make your products and listings stand out by showing customers exactly what the product is and how it can help you.
Do you have more questions about using infographics? Let us know down in the comments!
4 comments on “Amazon Infographics for Product Listing Optimization”