
 No Comments


As the glitz and glam of New York Fashion Week draws to a close, a full analysis of the year’s runway-to-retail trends is likely months away. In the real world, 2024 fashion trends are already moving the needle on Amazon.
Instead of front-row seats and champagne, this week’s blog post is serving the latest Jungle Scout Cobalt data on a few distinct yet powerful trends driving sales across the Clothing, Shoes & Jewelry category on Amazon. From the viral, TikTok-born “mob wife aesthetic” to in-vogue closet staples, we’ll explore keyword search trends and sales and revenue data from leading products and brands across a series of popular segments within this larger Amazon marketplace category.
The Return of Bold Glamor
Generally credited back to a TikTok video posted in early January, the mob wife aesthetic trend — inspired by the portrayal of wives of organized crime figures in popular media like the Sopranos — is breathing new life into vintage looks featuring big gold jewelry, animal print, and fur coats. The video garnered millions of views and inspired an avalanche of content, and backlash, exploring the fashion look.
On Amazon, keyword search variations for fur and faux fur coats have increased upwards of 400% in the past three months, with keyword searches for animal print dresses and gold hoop earrings up more than 100%.
Keyword search trends
- Gold hoop earrings – Up 161%
- Animal print dress for women – Up 146%
- Cheetah print dress – Up 101%
- Leopard print dress – Up 75%
Faux Fur Jackets & Coats
Market Insights
- Revenue: Up 3%
- Unit sales: Up 18%
- Median price: Down 1%
- Competing brands: 11
*Data represents data from Jan 12, 2024 – Feb. 10, 2024, as compared to the previous 30-day period between Dec. 13, 2023, and Jan. 11, 2024.
Vintage fur coats and faux fur jackets and trim are a quintessential element of the “mob wife aesthetic” trend. Unit sales in this segment on Amazon increased 18% in the past month compared to the prior 30-day period.
Keyword search trends
| Faux fur coat women | Up 469% |
| Fur jackets for women | Up 336% |
| Fur coats for women | Up 218% |
| Faux fur coat | Up 175% |
| Fur coat | Up 148% |
Leading Faux Fur Jackets & Coats
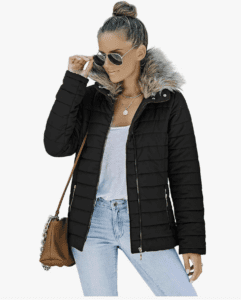
This popular, quilted winter coat with a faux fur lapel from Vetinee has become a popular choice among consumers over the past month. Revenue for the period is up 1,990% compared to the previous 30-day period.
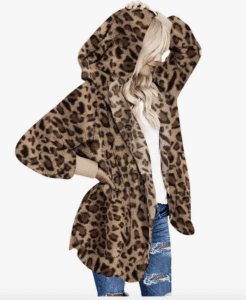
Another best-seller, this faux fur hooded cardigan coat from Lookbook Store is available in a variety of colors and patterns, including leopard. Revenue for the past month increased by 1,998%.
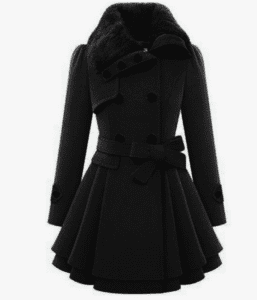
Revenue for this popular trench coat with faux fur accents by Zeagoo increased 100% over the past month.
Bamboo Pajama Love Sees Sustained Momentum
While initial consumer interest in bamboo fabrics emerged in the early 2000s, a surge in the popularity of bamboo pajamas is more recent and gained significant steam throughout 2023. Driven by a combination of sustainability concerns, influencer marketing, and a focus on wellness, this popularity has sustained momentum in 2024, as evidenced by Amazon keyword search data from Jungle Scout Cobalt.
Keyword search trends
| Womens bamboo pajamas set | Up 350% |
| Bamboo pajamas for women | Up 260% |
| Viscose pajamas for women | Up 196% |
| Bamboo womens pajamas set | Up 169% |
| Bamboo pjs for women | Up 116% |
Searches on Amazon for bamboo pajamas have been on the rise over the past 90 days. Among the most popular variants, searches for “viscose” — a more specific name for the fabric made from eucalyptus and/or bamboo trees — increased 260%.
Market Insights
- Revenue: Up 20%
- Unit sales: Up 11%
- Median price: Up 2%
- Competing brands: 7
*Dara represents data from Nov 13, 2023 – Feb. 10, 2024, as compared to the year-ago 90-day period between Nov. 13, 2022, and Feb. 10, 2023.
Top Brands Competing for Bamboo Pajama Sales
Market Share Leaders
- GYS – 34% (Up 42% YoY)
- Posh Peanut – 25% (Up 364% YoY)
- Wiwi – 21% (Down 345 YoY)
- Lil Sleepies – 14% (Down 60% YoY)
- Nachila – 3% (Up 32% YoY)
*Data represents data from Nov 13, 2023 – Feb. 10, 2024, as compared to the year-ago 90-day period between Nov. 13, 2022, and Feb. 10, 2023.
The movement in market share over the past year in this segment suggests a dynamic space with shifting customer preferences. GYS leads the bamboo pajama market on Amazon with 34% share. Posh Peanut is a rising star, boasting a massive 364% YoY growth and capturing 25% of the market. Wiwi and Lil Sleepies experienced declines, while Nachila shows moderate growth.
Leading Bamboo Pajamas on Amazon
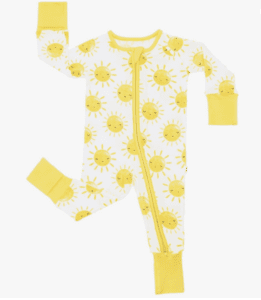
This adorable zippered baby pajama from Lil Sleepies earned the largest amount of revenue in the segment over the past three months, up 100% compared to the previous 90-day period.
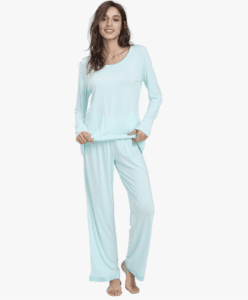
This womens pajama set, available in a wide variety of colors, from GYS continues to grow in popularity; revenue grew 237% over the past three months.
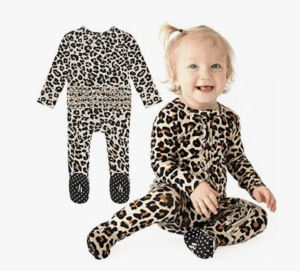
Posh Peanut’s footed baby pajamas are another favorite among consumers for infants and toddlers. Revenue increased 73% in the past three months.
See how to get Amazon insights on your market share, sales trends, competitors, and more. Book a Cobalt demo.
Accessories
The iconic fashion designer Marc Jacobs once said: “Any opportunity to adorn oneself is human, and accessories are an easy way to do it.” When it comes to fashionable — and functional — accessories, hats, leggings, and sunglasses are arguable classics. So, which brands and products are leading in this market on Amazon in 2024?
Segment spotlight: Hats
Keyword search trends and revenue for this segment, which excludes winter headwear, point to consistent demand for hats, particularly among men, no matter the season. Revenue for this segment increased 15% over the past three months, while unit sales increased 13%.
Market Insights
- Revenue: Up 15%
- Unit sales: Up 13%
- Median price: 0%
- Competing brands: 56
*Data represents data from Nov. 13, 2024 – Feb. 10, 2024, as compared to the previous 90-day period between Aug. 15, 2023, and Nov. 12, 2023.
Market Share Leaders
- Goorin Bros – 14% (Up 7% YoY)
- Ladybro – 12% (up 145% YoY)
- Voboom – 11% (Up 43% YoY)
*Data represents data from Nov. 13, 2024 – Feb. 10, 2024, as compared to the previous 90-day period between Aug. 15, 2023, and Nov. 12, 2023. Percentages indicate the year-over-year increase or decrease in a brand’s market share.
Goorin Bros, a family-run hat company since 1895 that has since expanded its brand to the Amazon marketplace, has the largest share of this market at 14%. Its revenue for the past three months increased more than 30% compared to the previous 90-day period.
Keyword Search Trends
When it comes to accessories, men’s hats are experiencing a surge in popularity. Perhaps in anticipation of warmer days ahead, keyword searches for golf hats have seen the largest increase, up 78%. Celine sunglasses reign supreme in the eyewear category with 92% search growth, while oversized women’s sunglasses (see “mob wife aesthetic” above) also see rising interest. “Women’s activewear leggings” leads the charge in that segment with a 447% search increase, indicating a strong focus on athleisure and gym-ready styles.
Hats
Golf hats men – Up 78%
Hats for men – Up 52%
Trucker hat – Up 7%
Sunglasses
Celine sunglasses – Up 92%
Tinted sunglasses – Up 21%
Oversized sunglasses womens – Up 10%
Leggings
Women’s activewear leggings – Up 447%
Seamless legging – Up 167%
Lightweight leggings for summer – Up 122%
Opportunities for Brands in Clothing, Shoes & Jewelry
The Clothing, Shoes and Jewelry category on Amazon is vast, but navigating niche markets within it is easy with the right intel. Layering those insights across the latest trends can help identify opportunities — such as those outlined here — that may otherwise be overlooked.
By studying the competitive landscape and capitalizing on emerging search trends, both new and established brands and Amazon sellers can build growth, gain momentum, and gain significant traction with today’s fashionistas.
See how to get Amazon insights on your market share, sales trends, competitors, and more. Book a Cobalt demo.
About This Report
The product data in this report is representative of the U.S. Amazon market. Market insights on Amazon products were sourced from Jungle Scout Cobalt, an industry-leading market intelligence, advertising optimization, and ecommerce reporting platform powered by nearly 2 billion Amazon data points.
We encourage you to share, reference, and publish this report’s findings with attribution to “Jungle Scout Cobalt” and a link to this page.
For more information, specific data requests, media assets, or to reach the report’s authors, please contact us at [email protected].