
2021 Global Imports Report
U.S. imports grew 33% in early 2021, with projected annual growth of 20% — barring major pandemic-related disruption, that is.
Jungle Scout’s 2021 Global Imports Report explores trends among maritime imports to the U.S. between 2015 and the first half of 2021 across 237 countries and all industries.
This report uncovers:
- Import trends by region and industry
- How U.S. reliance on international trade has shifted since the onset of the COVID-19 pandemic in early 2020
- Where different products are sourced worldwide and the best alternate suppliers by industry
Share of U.S.
Imports by Country
2015-2021
The top 10 countries have consistently captured ~70% of the total share of imports to the U.S. since 2015, with China accounting for about 40% of the total share.
However, share of U.S. imports has fluctuated in recent years, with Vietnam consistently gaining share and India bouncing back from a challenging 2020.
Compared to early 2020, India, Vietnam and Italy are the countries that increased their share of total U.S. imports the most. Australia, New Zealand and Canada experienced declines during this same time period.
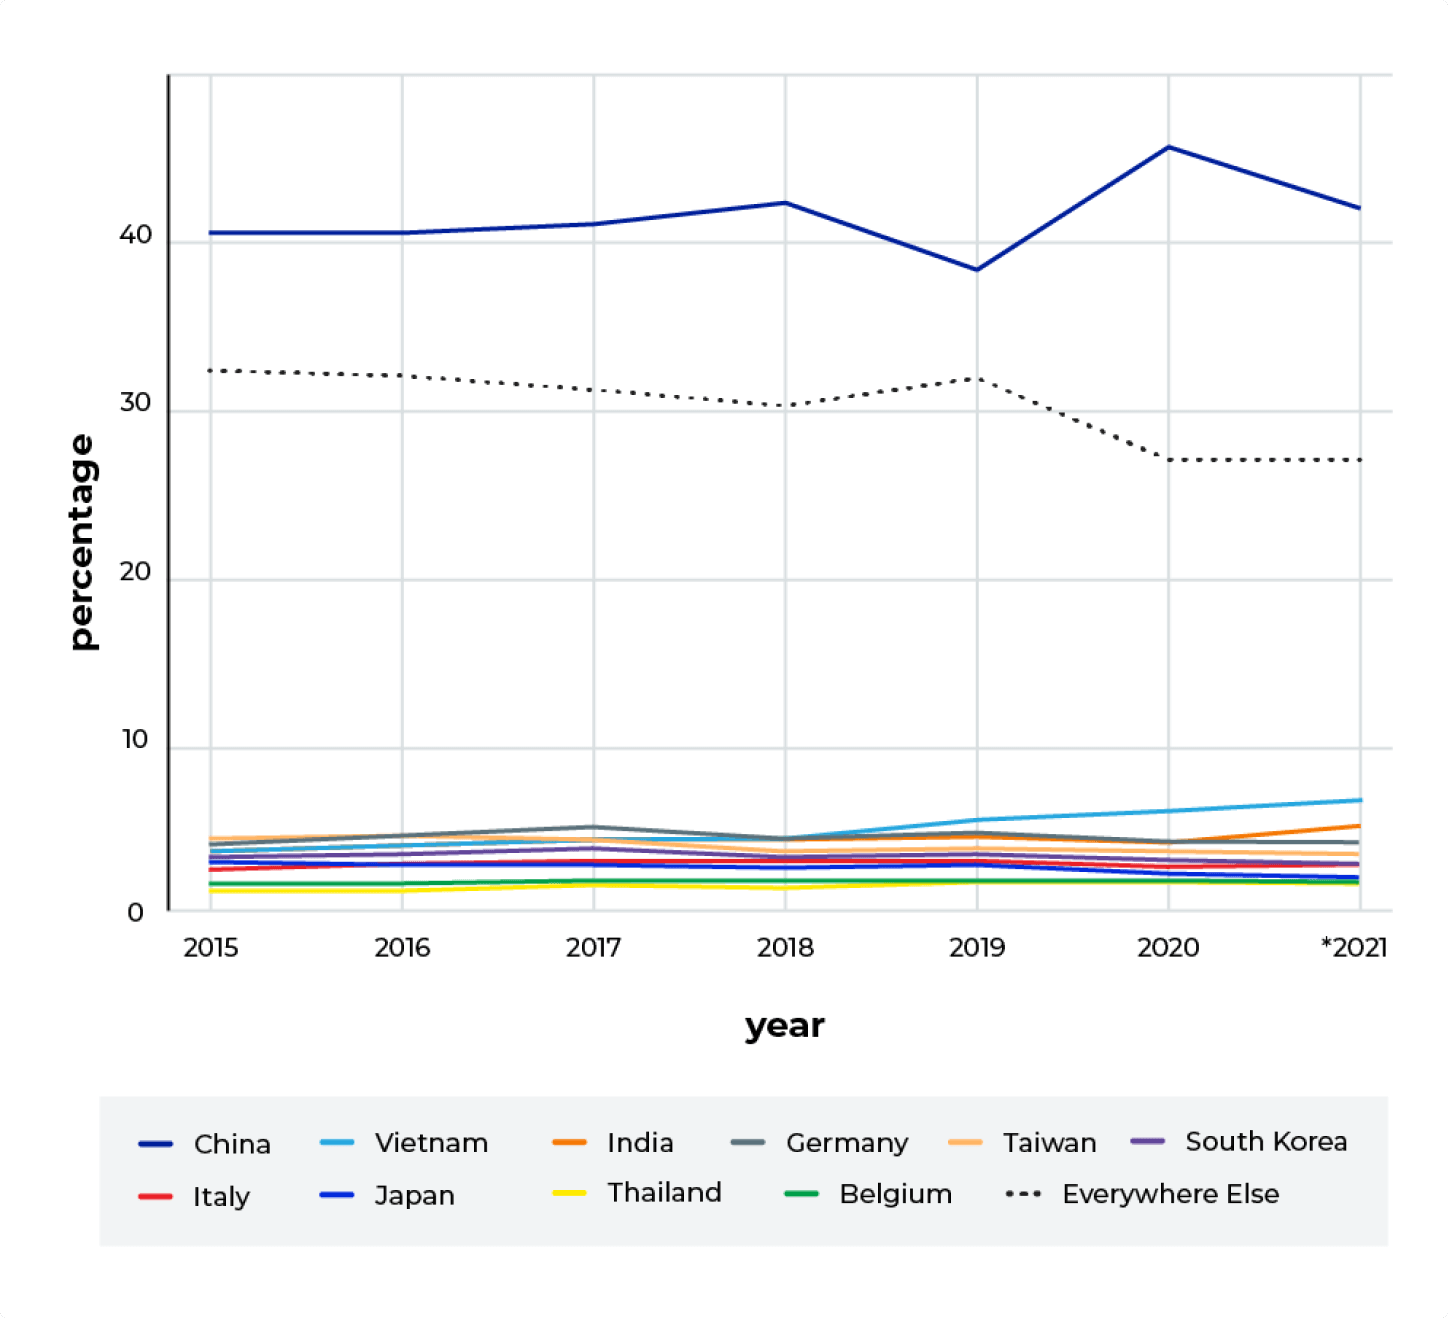
*Data from 2021 represents Jan. 1-June 30, 2021 only.
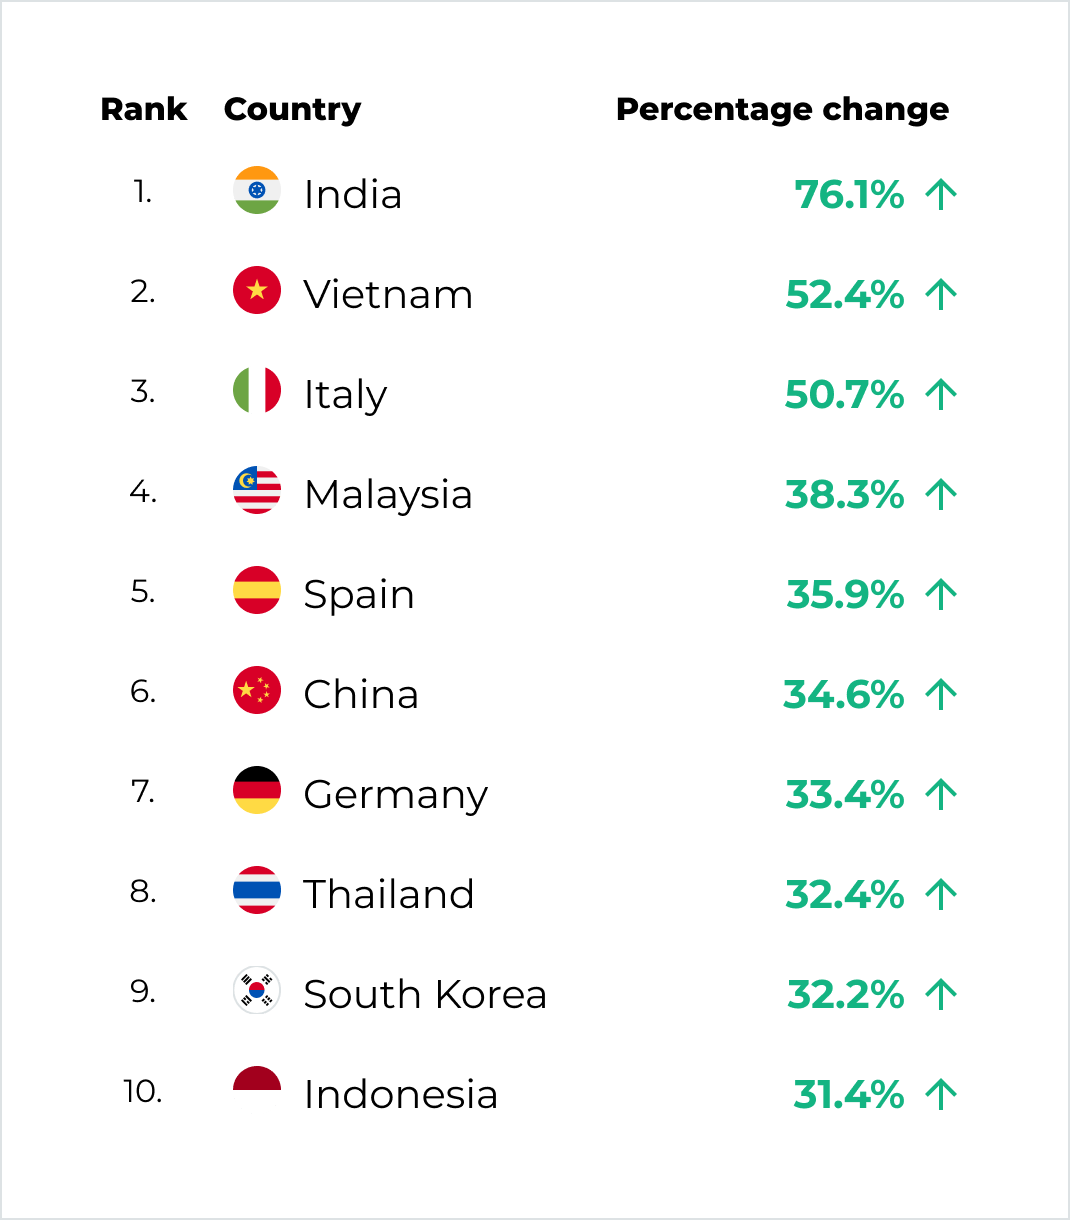
The Top 10 Trade Partners That Are Increasing Exports to the U.S. in 2021
5 Major Trade Partners That Are Reducing Exports to the U.S. in 2021
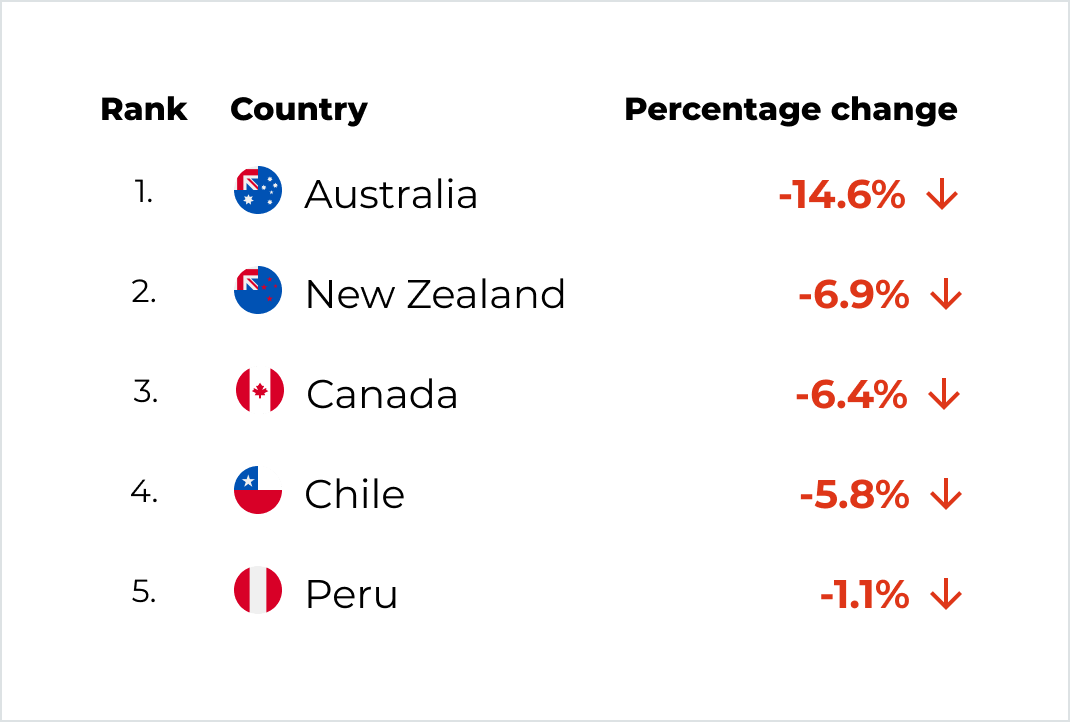
Data comprises the top 50 countries exporting products to the U.S. in the first half of 2020 (Jan. 1-June 30) compared to those countries’ imports in the first half of 2021.
Share of U.S. Imports by Product Category | 2015-2021
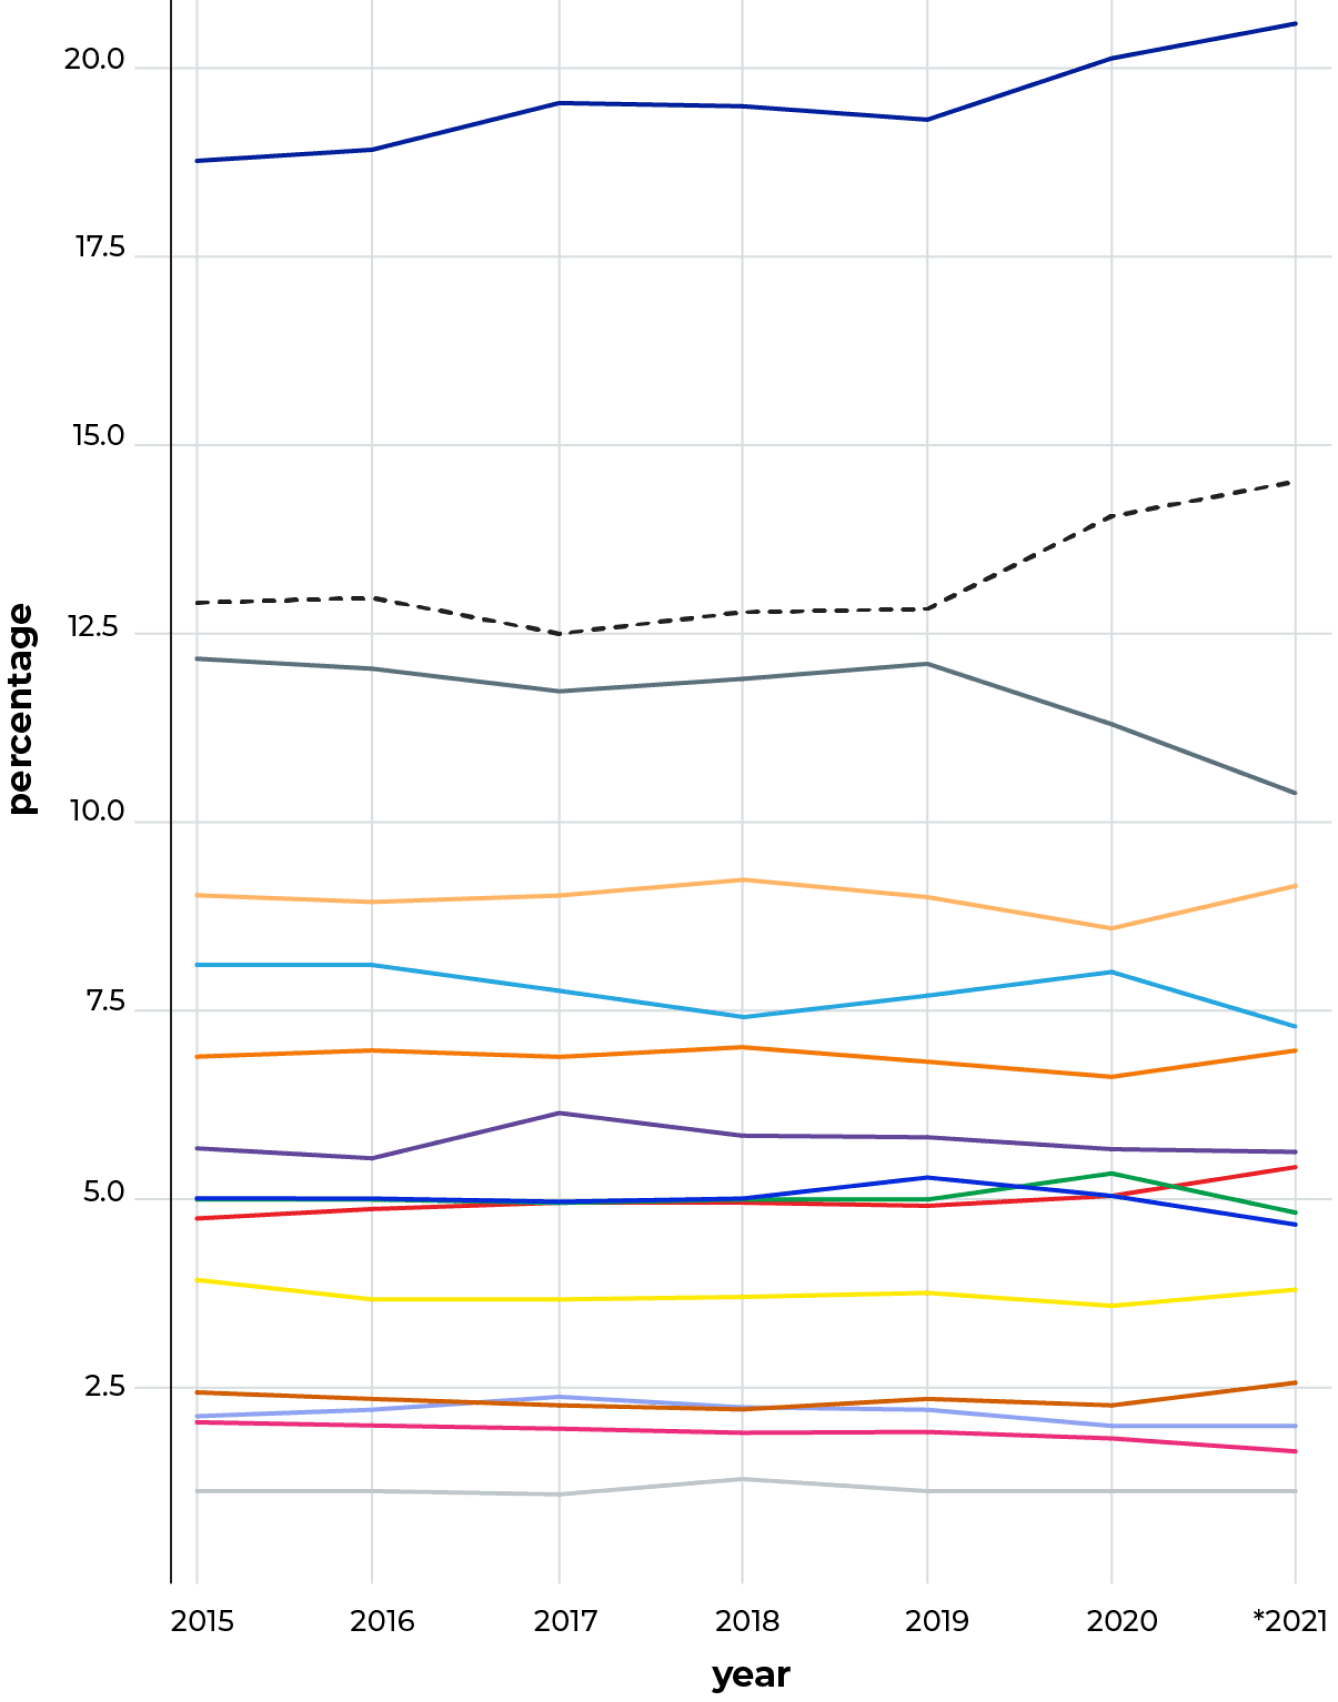
*Data from 2021 represents Jan. 1-June 30, 2021 only.
The machinery and electrical products industry has captured ~20% share of total U.S. imports since 2015. Overall, fluctuations in imports by category have remained minor, although the miscellaneous category (which includes items like furniture, toys, art and more) and the stone & glass category saw a 19% increase from the first half of 2020. The wood & wood products category saw a 16% decrease within this timeframe. Additionally, the textiles category decreased again in share by 9% after experiencing a 7% decrease from 2019 to 2020.
Which Industries Are Increasing Exports to the U.S. in 2021?
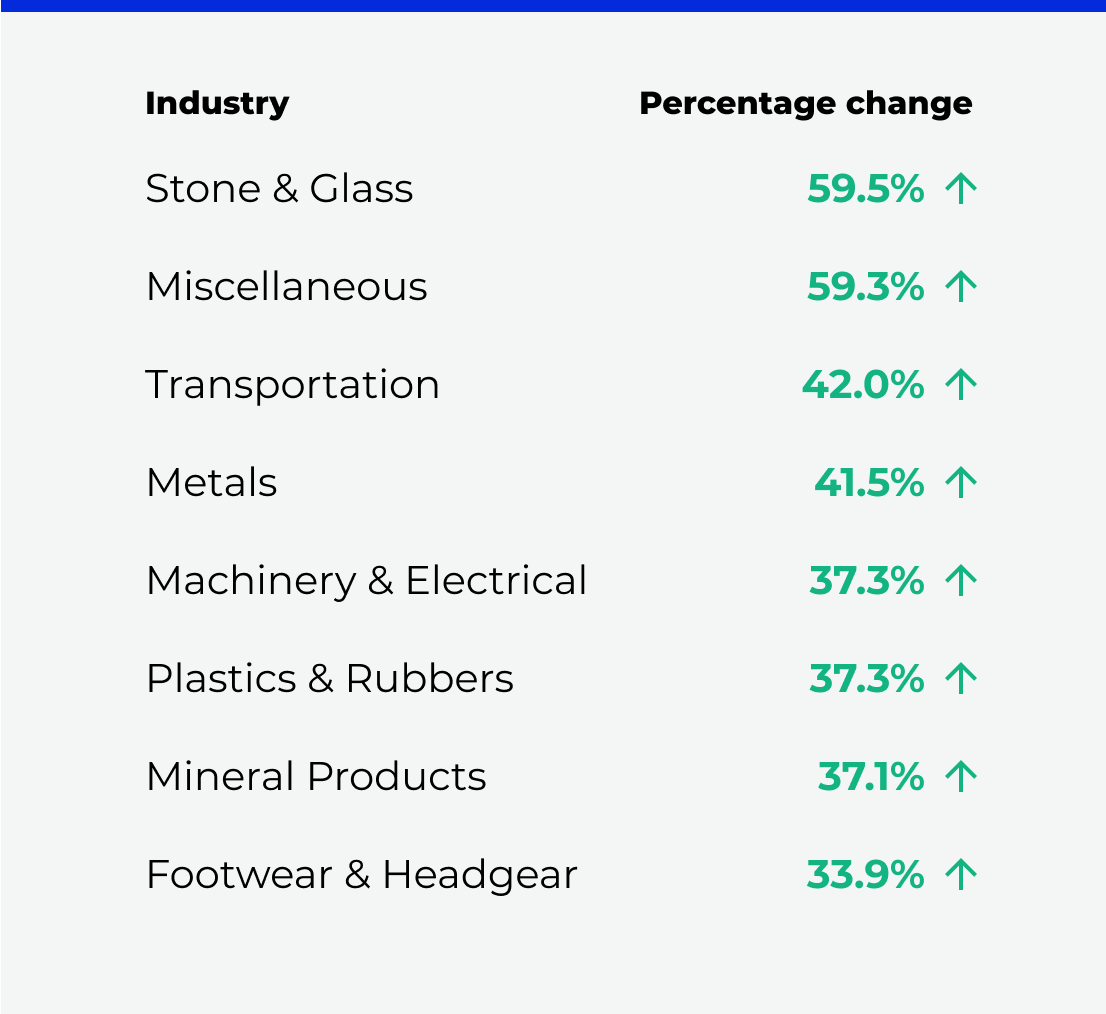
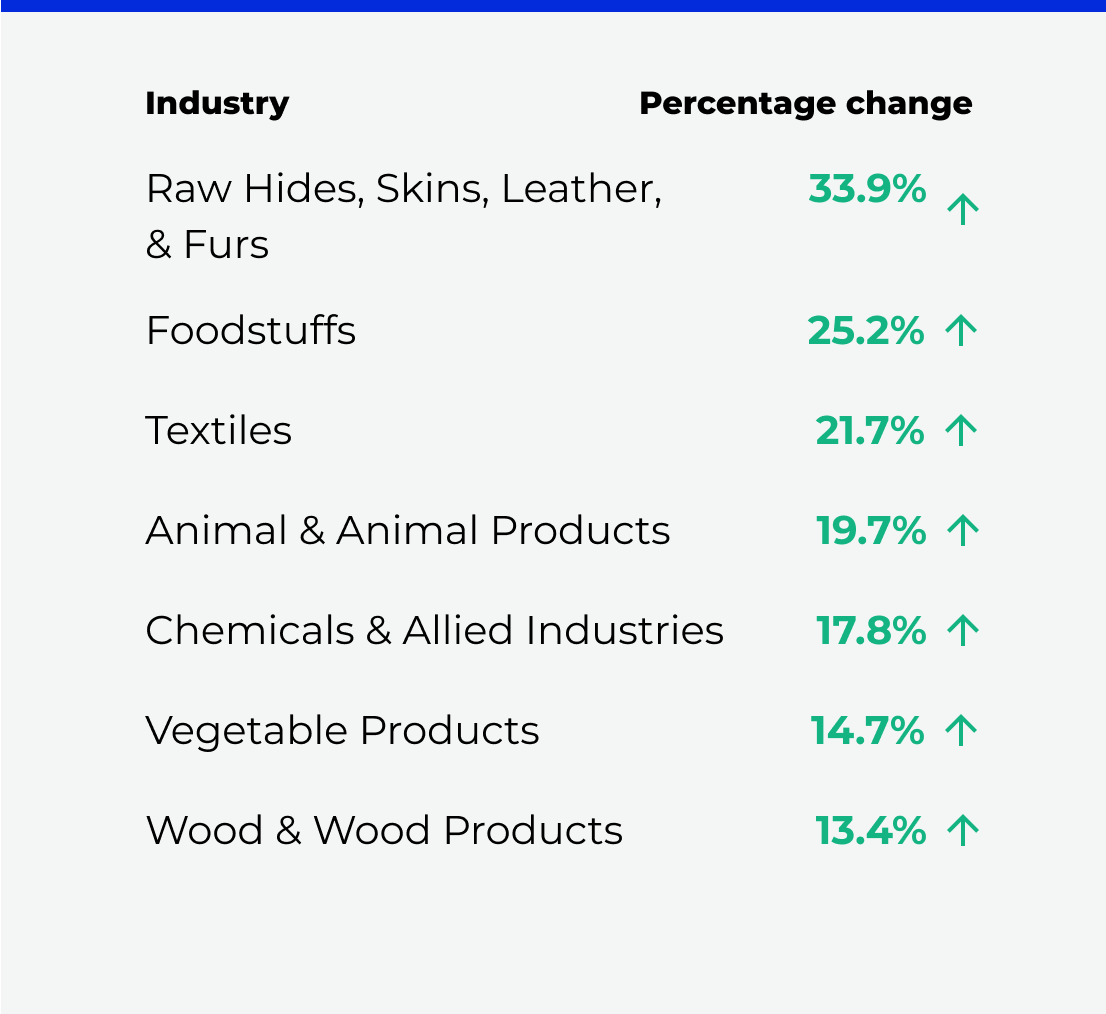
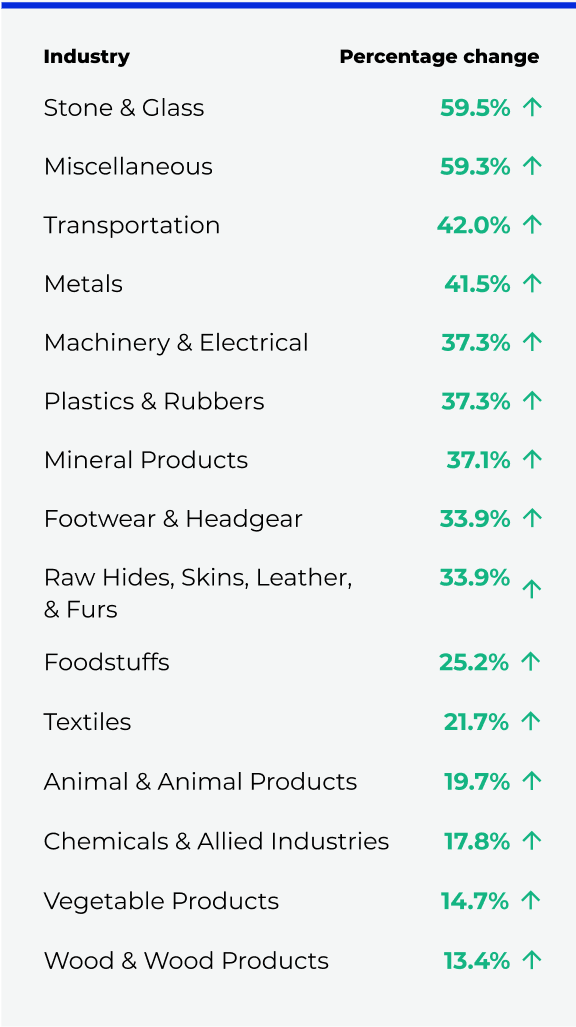
Data comprises all industries exporting products to the U.S. in the first half of 2020 (Jan. 1-June 30) compared to those countries’ imports in the first half of 2021.
About the report
Methodology
All data represents United States maritime imports from January 1, 2015, to June 30, 2021 from 237 unique countries. Jungle Scout analyzed more than 79 million maritime U.S. import records, including information on the shipper and shipment, from which country and category are extracted.
Using the data
We encourage you to explore Jungle Scout’s Global Imports Report, and to share, reference, and publish the findings with attribution to “Jungle Scout” and a link to the report web page.
For more information, specific data requests or media assets, or to reach the report’s authors, please contact us at [email protected].
About Jungle Scout
Jungle Scout is the leading all-in-one platform for selling on Amazon, with the mission of providing powerful data and insights to help entrepreneurs and brands grow successful Amazon businesses.
Past reports
2020 Global Imports Report | Read report
Related industry reports