
 1 Comment
Whilst I was working behind the scenes battling with getting our Europe Amazon Seller Central account approved, organizing shipping, VAT registration and other details, we decided to run a session on Amazon seller analytics.
This is something that you will need to get a handle on as soon as your inventory lands and you start making sales. An efficient business always stays on top of it’s important financial metrics. It’s the only way to fully understand the health of your business, and identify areas of improvement or growth.
So in this session we had Shane Stinemetz, Director of Fetcher, join Greg and myself, to explain how to calculate your Amazon business profit and loss.
Jungle Slumber Updates
Transparency is key for this case study so here’s some of the latest updates about the launch of my first product, Jungle Slumber sleeping bags. As I mentioned in previous sessions, it took several weeks to get our new Europe Seller Central account verified. There wasn’t anything wrong in particular, they just kept asking for more information, which we provided, and it took them a long time to process things.
Again – it’s always best to sign up for things like Seller Central, or register your business, or for VAT as early as possible if you know you are going to sell. This prevents any unwanted headaches.
For me I had to move forward for the purposes of the case study, so I decided to keep 300 units with the supplier ready for air shipment when the FNSKU becomes available. Then, I worked with Flexport to get the ocean shipment on the sea, and decided to take the hit and pay Amazon to label the products with FNSKU’s when they arrived.
Shipping Problems?
I hit another barrier here. Flexport wanted to ship my ocean freight FCL (full container load) because the sleeping bags almost fill up a full container. However, the supplier was not expecting FCL and therefore their costs to get the shipment to the port in Shenzhen, China, were more than they expected. (We agreed upon FOB incoterms, which means the supplier ships the goods to the port and then your forwarder takes over from there). 👍
In the end, we concluded that using FCL at this stage would be the most efficient. With the holidays coming up, it was time to figure out a solution. So between myself, Flexport and my supplier, we negotiated. It end up costing an extra $130 for us to cover some of the extra costs for the shipment to the port in China.
My lesson learnt here? Always check with your forwarder whether the shipment should be LCL or FCL before finalizing your supplier agreement. That way, you can get them to agree to the shipping terms and associated costs in advance.
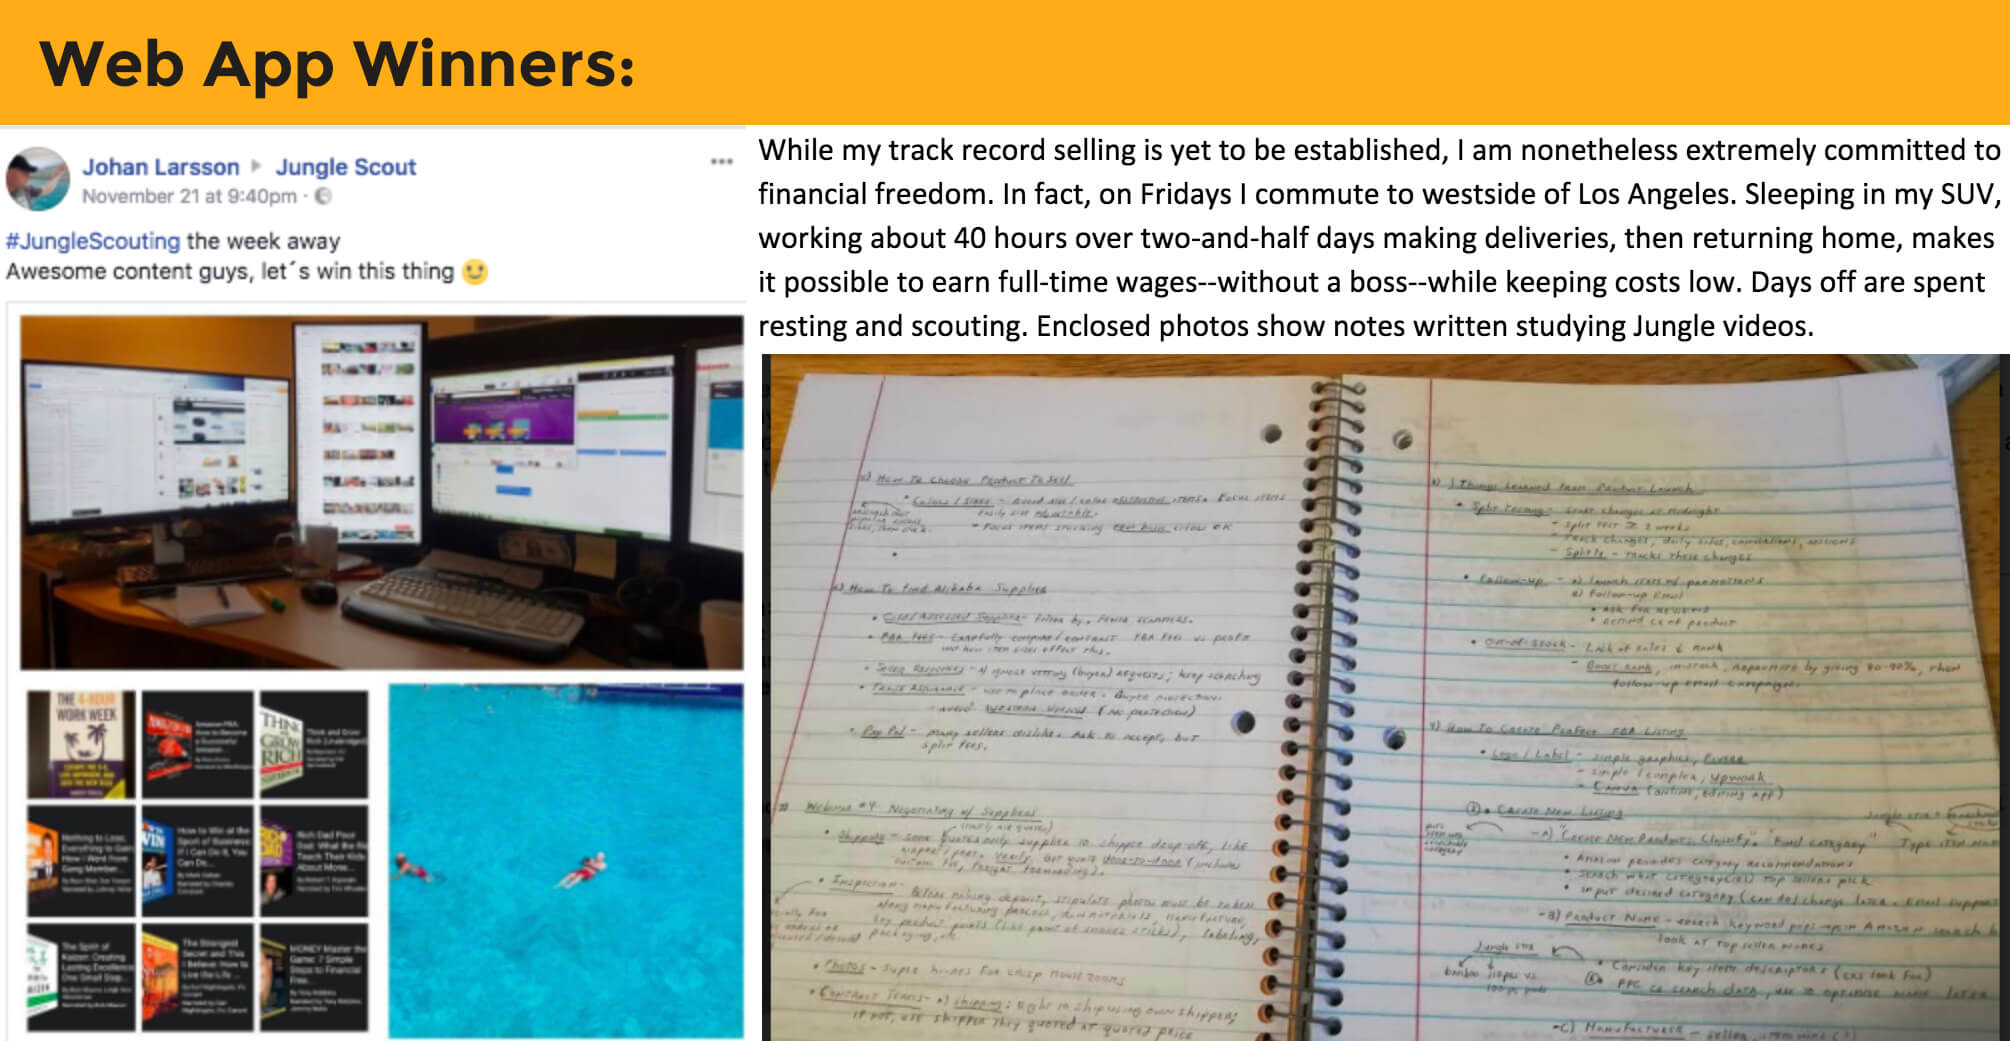
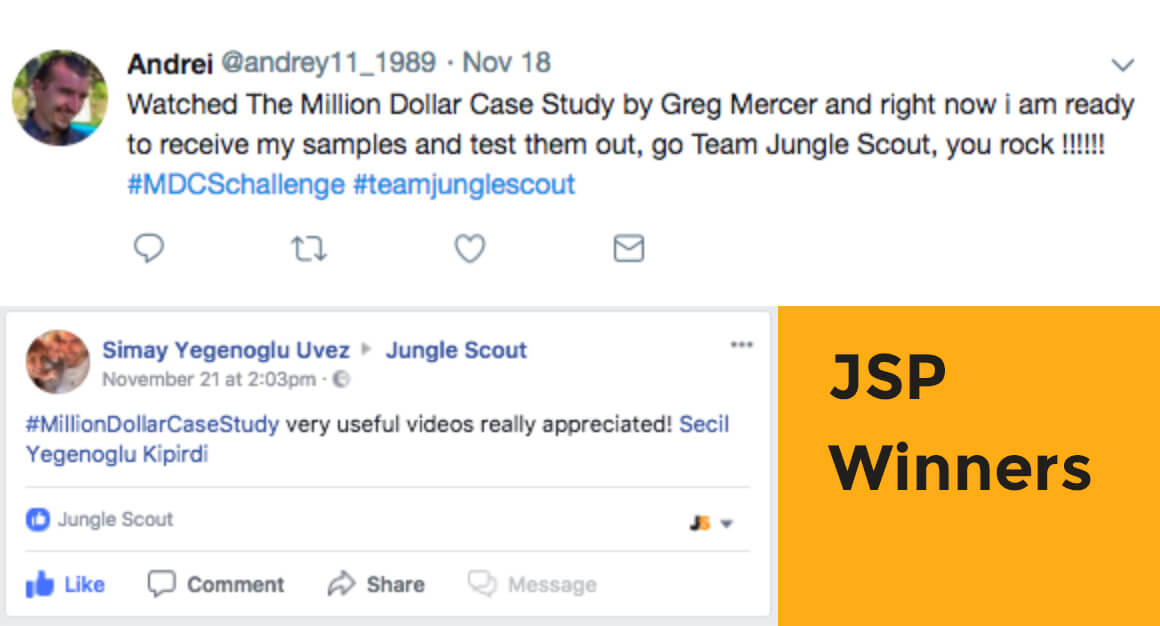
Giveaway Winners
Before I dive into it, I wanted to share some of the giveaway winners from the past few weeks. We get some really inspirational messages from the community and these are some of the latest stories of people who have won some free JS prizes:
Amazon Seller Analytics: What we will cover
- Managing your Amazon seller financial analytics
- How to manually calculate the health of your business
- Automating this process & ditching excel
Here’s your full recap video:
Shane is an Amazon seller himself, and is a direct result of our JS case studies, as he started some two years ago when the Jungle Stix case study began. We talked a little bit about perseverance, which is a great lesson to learn. It definitely takes some perseverance to get through this process and reap the benefits 👍
But remember that the rewards can be huge: financial freedom, location independence and more time to spend doing what you love being some of the ones that I find the most exciting!
You Are Now A Business Owner: How Will You Handle Finances?
When Shane and Greg first started selling, they tried some DIY methods of keeping track of business finances, and found this time consuming, frustrating, and worst of all, inaccurate. Even if you are great at math, figuring out business accounting and financials can be tricky. This is how Fetcher came about, when Shane realized there had to be a better way to have accurate metrics and save hours of time!
So, there’s two methods to the madness here:
- Use Seller Central to download all of your data and crunch the numbers yourself
- The Fetcher method
Using Seller Central: The Manual Method
When doing this task yourself, you are going to need to download a handful of reports from Seller Central and put these into a spreadsheet template, along with other metrics that are not in Seller Central, like Cost of Goods.
It can take days to get your template set up correctly, using formulas and maybe even macros, in order to partially automate this process each time you want to see your data.
Greg and Shane have been sellers for some years now and have both struggled with this method. The main issue is that Seller Central doesn’t make it easy for you. Not all of the information you need is in Seller Central, and it’s really not that easy to get full visibility of all of the little pieces of data that are hiding in your day-to-day business operations, like refunds, coupons and other fees and costs.
So ultimately, the main difficulty with this method is that you can end up thinking you are making more, or less profit, than you actually are. Not ideal!
Pros:
- It’s free as your data is already in seller central
- You might learn some things along the way, such as how business accounting and financials actually works
Cons:
- You will have to spend hours (or pay someone) to create a working template, and then manually download reports and merge these into your template each time you want to see your reports
- It could still end up being inaccurate
The Fetcher Method
Shane walks us through Fetcher and how it fetches and calculates all of your business costs. This helps to illustrate how much time it could save you by investing in this tool. But equally, even if you did want to go down the manual route, a dive into Fetcher should at least help you out by highlighting what metrics and calculations you should be working on. What ever method you decide to take, make sure you stick around until the end for a completely free trial 😉
I will run through the screens that Shane shared with us here, but make sure to check out the full replay for an in-depth explanation!
Overall Metrics Dashboard
This shows data for all of your products in your account, including your total sales and costs. You can check out your top-line total sales between any dates you specify.
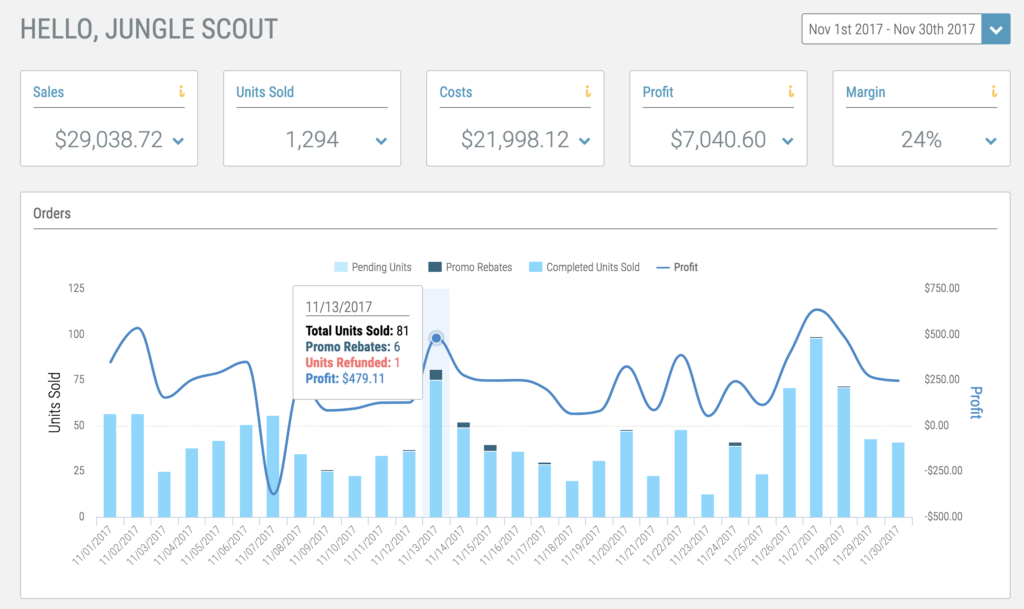
The smart thing about this dashboard is that behind the scenes it’s calculating all of the other metrics like refunds, reimbursements and rebates. When you review your reports in Seller Central here:
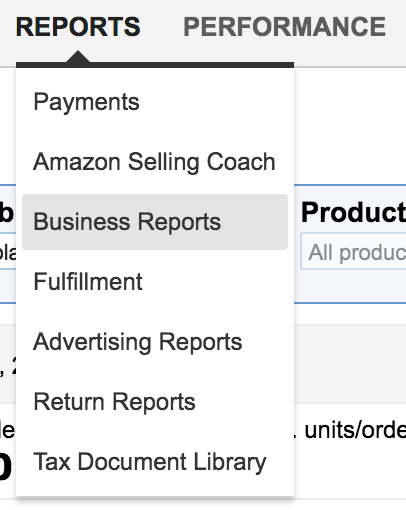
It is *not* calculating all of this data for you, so you will actually be looking at total sales that are not a true representation of your profits. Conversely, Fetcher is pulling all of the relevant data, including all of your refunds, reimbursements and any costs you enter into the tool directly, and calculating your true profits.
Everything that happens in Seller Central will be calculated by Fetcher, which reduces the risk of missing something and getting inaccurate results.
How does Fetcher get this data?
We get the information from Amazon’s API. When you sign up for Fetcher, we will gain access in order to pull this information from Amazon on your behalf and then this data will automatically be calculated using our algorithms and calculations to report the metrics you see in the Fetcher dashboard.
If you’re worried about data privacy, you can check out the privacy policy here. But in a nutshell, your data is never shared or used against your will, it’s simply being pulled right from Amazon and fed into your own personal analytics dashboard (after a few calculations).
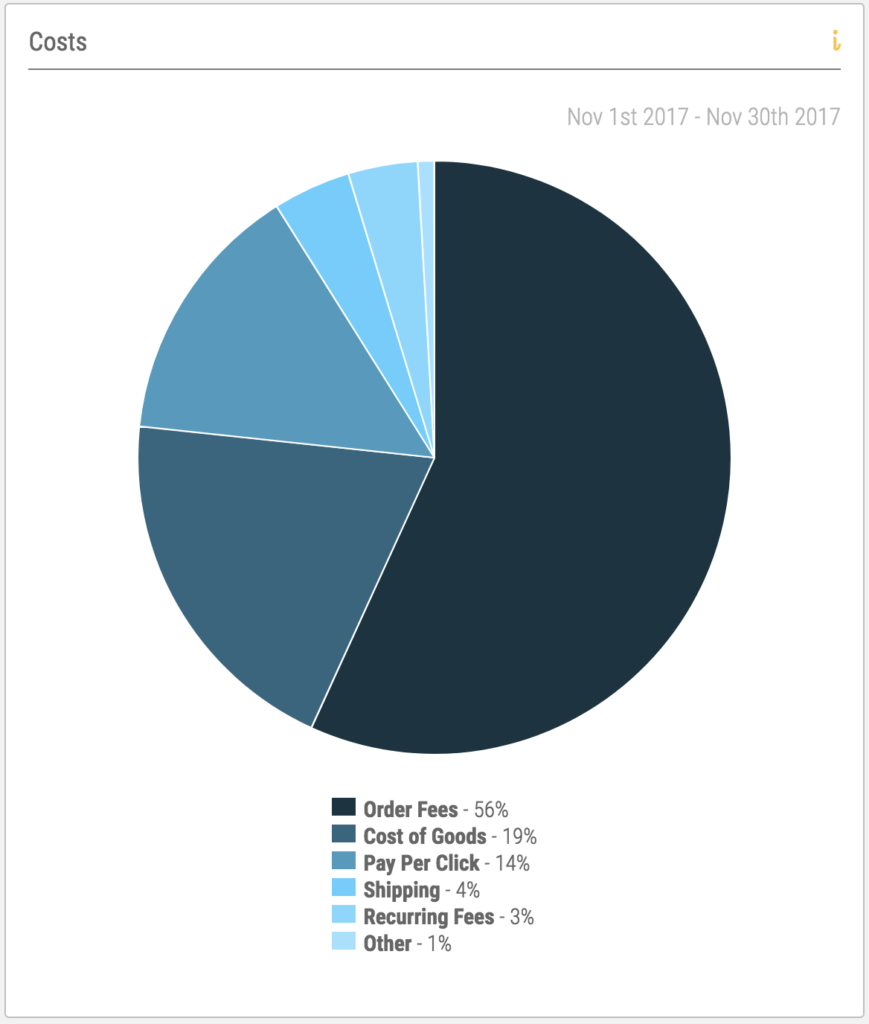
Top Level Costs
The top level costs can be seen in your main dashboard too. Shane points out that it’s very common to see fees as the main bulk of your costs. That’s just the nature of the business, and something you need to be aware of and prepare for during your research process:
Expenses and Cost of Goods
Fetcher needs some information from you too – but not much, and providing you have kept track of all of your costs along the way you should be able to fill this in within minutes.
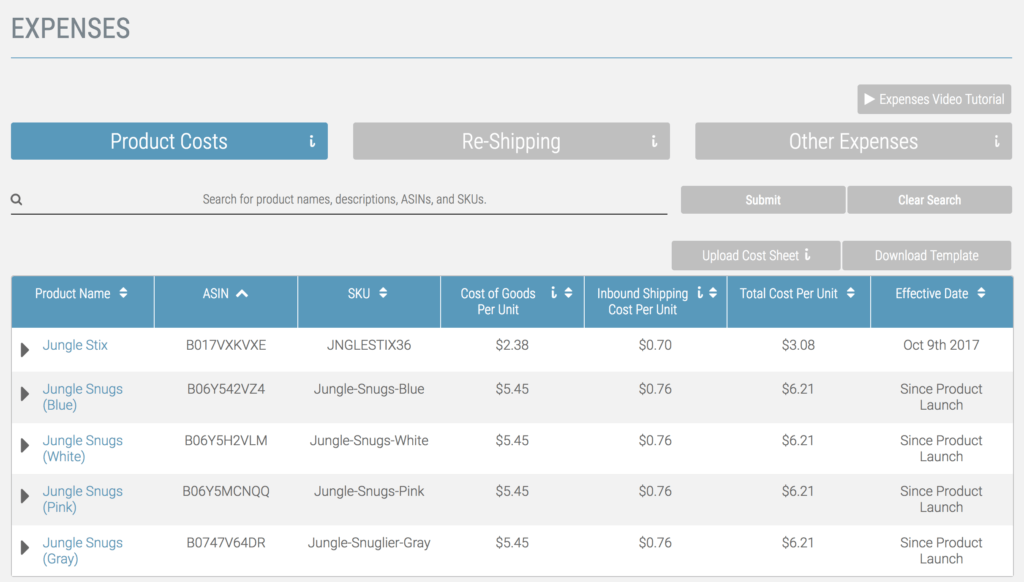
You need to add in your cost of goods, as well as shipping, and any other expenses you might have, such as photography, software, additional air shipping, your seller central subscription or design costs.
It’s super easy to do this and ensures that you aren’t leaving any additional costs out, which results in inaccurate profit calculations.
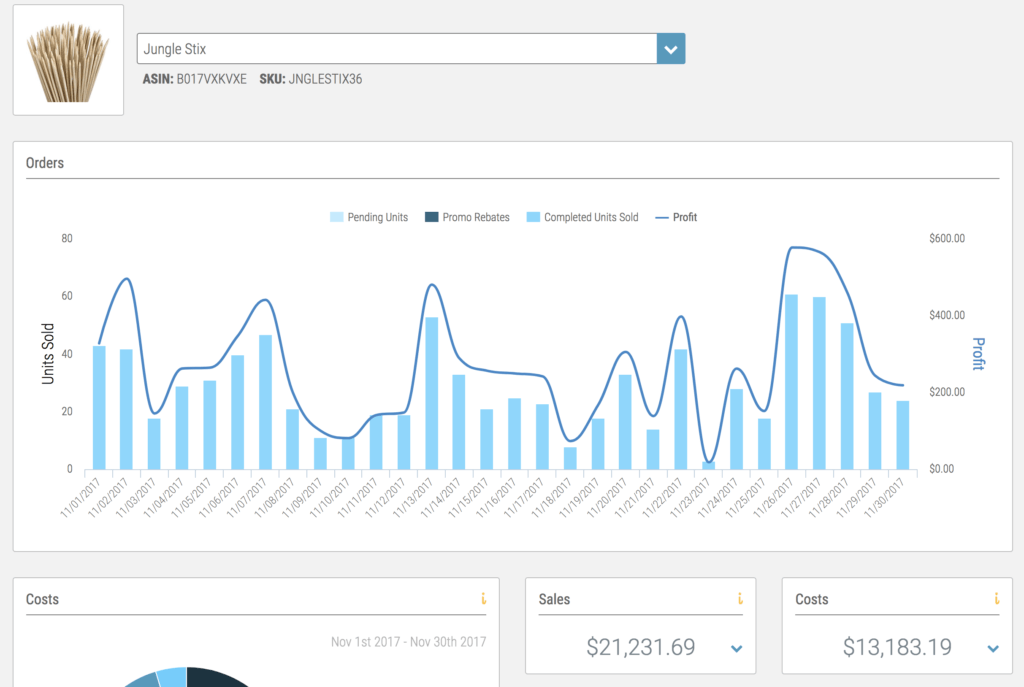
Product Breakdown Tab
It’s one thing to have an overall view of your business, but of course you will want to know at the SKU level how your products perform. This is super useful in identifying where you might need to make some improvements, maybe optimize your listing, or make product improvements. Especially once you start to scale and sell more products, it’s very useful to see which ones are the winners.
From what I have heard in the FBA community, it’s pretty normal for an FBA business to make most of its profits from 20% of it’s products. The 80/20 rule, you 20% of your items will fly and the other 80% will make steady sales. It’s still useful to have a combination of the two, even the 80% that have slower sales add up when you combine them together.
Having said that, it’s still important to monitor all of your SKUs and ensure you aren’t wasting marketing spend flogging a product that refuses to sell, or on a product that has come to the end of its lifecycle.
Sales & Profit
There is also a handy screen that helps to show you which products are making the most profit (not just sales).
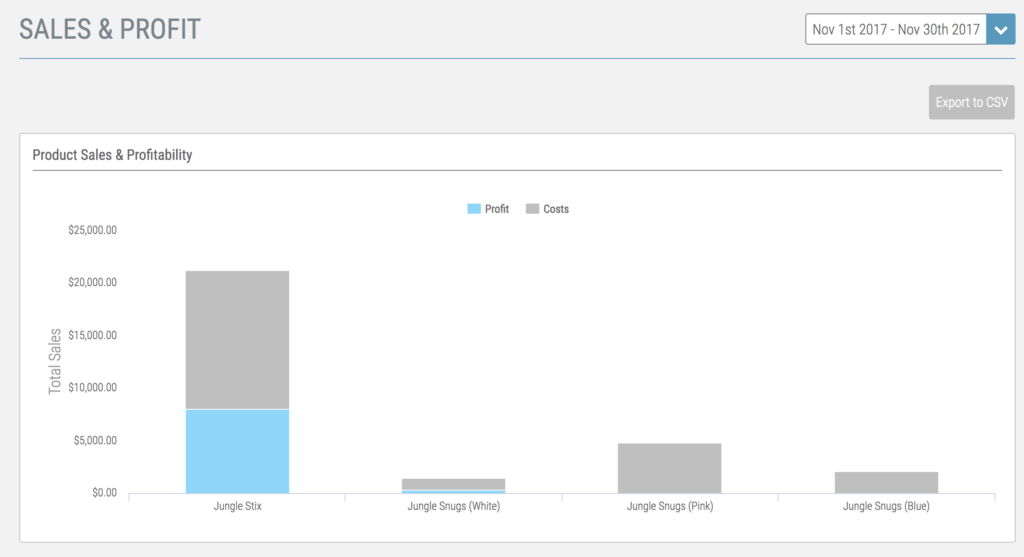
As you can see here, Jungle Stix is making headway in terms of profit for the month of November. This is largely because we are running some additional promos for the Jungle Snugs, which suffered a drop in sales after being out of stock.
Inventory Management
Speaking of being out of stock – you definitely should make every effort to ensure your stock levels are on point. We have been guilty of missing the mark on this a couple of times, and as a result, our sales and rank will suffer.
Fetcher can actually help you with this. Back on the main dashboard is an inventory tracker, which keeps an eye on your inventory levels. For each SKU you can add your lead time on the far right:
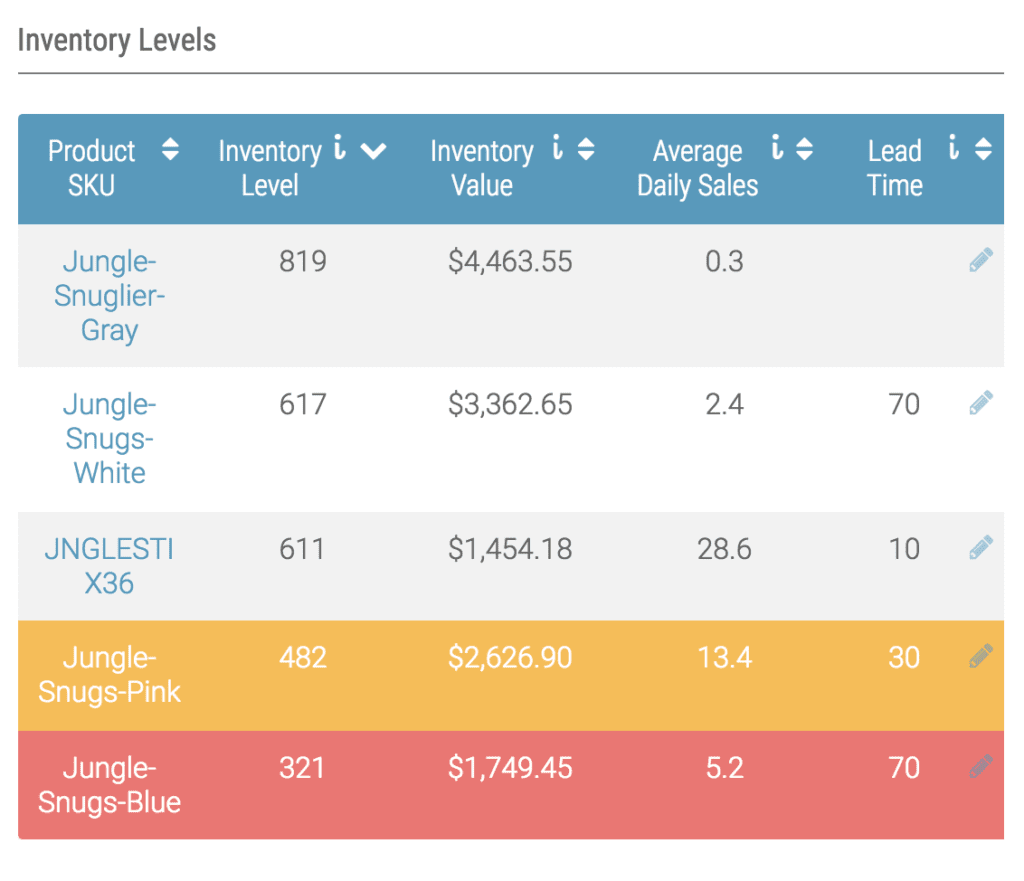
Once you add your lead times (this includes manufacturing time and shipping and all of the time considerations from placing an order to getting the product in the Amazon warehouse), Fetcher will let you know when you are in the danger zone of running out of stock unless you re-order. Your SKUs will actually turn orange or red to highlight this too.
This is a super easy way to keep on track with inventory management, and all you need to do is enter your lead times, log in and check where you are at.
Having inventory always in stock is important, but equally, having too much inventory can incur extra storage costs. So using this method you can re-order just at the right time, without having to calculate it yourself.
Refunds
Keeping an eye on your return rate is an excellent way to ensure you are doing everything right in terms of product quality, listing quality and so on. The refunds dashboard inside of Fetcher can show you at a glance how each of your SKUs perform:
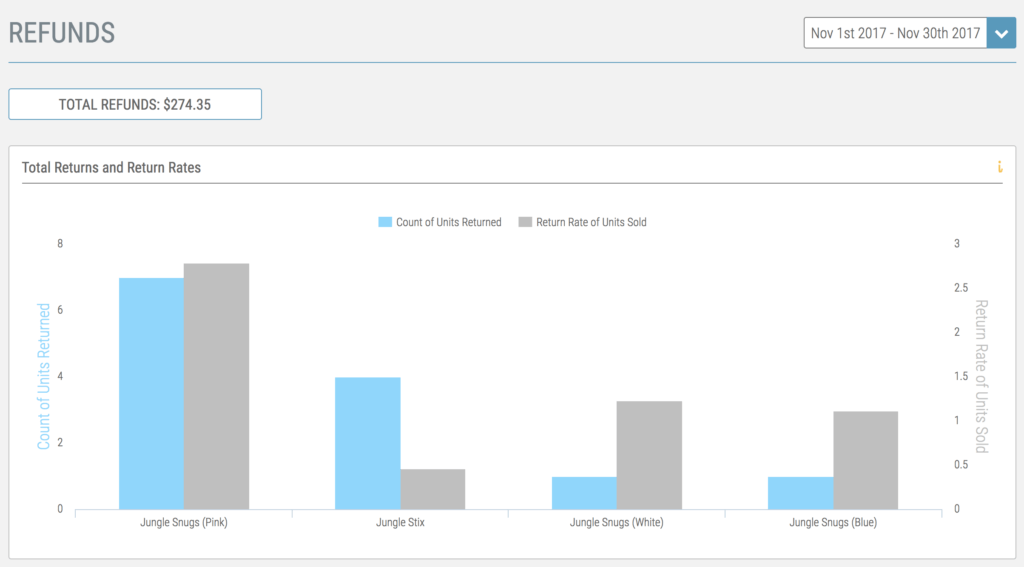
Shane advises that a returns rate below 3% is fine, but if you start to see returns creeping up to that amount or beyond, then it’s time to do some investigation. It looks like the Jungle Snugs Pink could use a little investigation right now, it’s still under the threshold but now would be the time to take action.
Below this chart you can see each return line by line, and click into each one and reach out to those customers. That way, you can find out if there is a quality issue, or if the product that arrived was not what was expected. Addressing issues like this within your FBA business is crucial to maintaining healthy profits and it also helps you to tweak your marketing, product offering and customer support.
One obvious negative impact of a growth in returns is negative reviews, which you definitely do not want, so this is a useful tool to help keep things on track.
Profit & Loss Page
This is such an important detail for any business owner to monitor on a weekly and monthly basis. This is where you can see how your revenue and profits are performing over time. You can watch growth, spot any unwanted dips in revenue and profits and also keep track of your expenses.
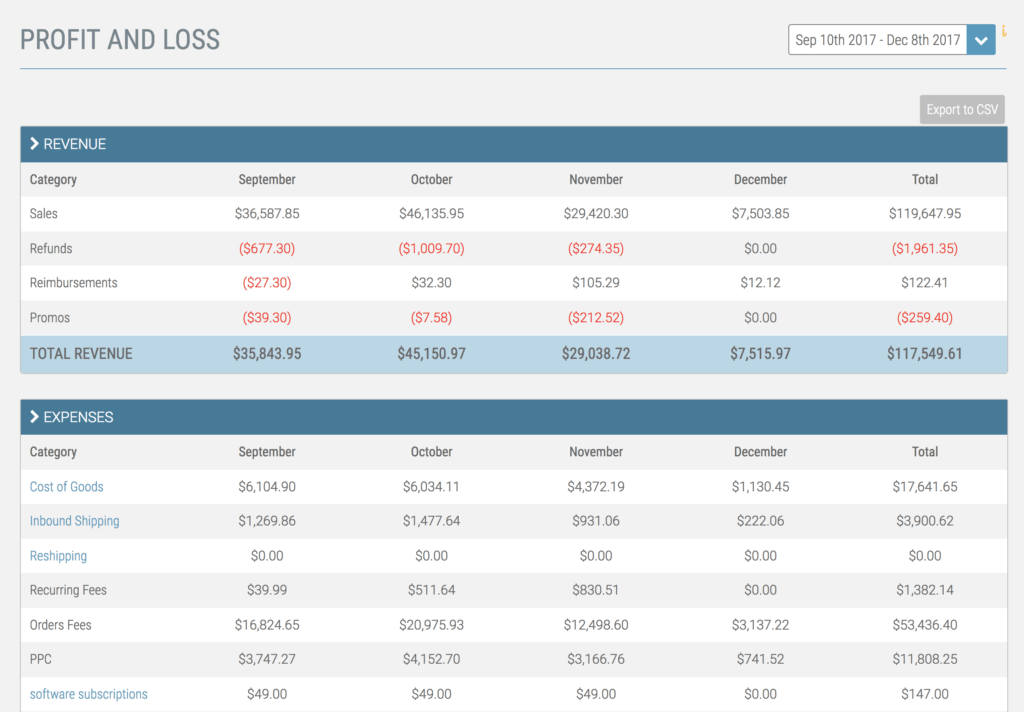
For the case study products, we saw a reduced revenue reported in November due to running some promotions due to running out of stock of the Jungle Snugs.
This report also shows where expenses might be coming in too high, for example, perhaps additional storage costs because you have too much inventory is becoming a burden and you need to rethink your inventory management. Or, perhaps your cost of goods is a little high and you may want to try negotiating better pricing with your suppliers now that you have formed good relationships.
If you don’t have background in finance, calculating all of the information you can see here on the profit and loss page (and all of the other pages), can take a long time and be very frustrating.
I for one am not the biggest fan of mathematics, or accounting, and I absolutely want to take advantage of Fetcher and add the Jungle Slumber product to this report when it’s in stock.
International Support?
Fetcher is going to support all marketplaces very soon, within the next couple of weeks. So for those of you tuning in who are scaling a business internationally, or thinking of selling in 2 or more marketplaces, you will soon be able to track all of these metrics across them all. Drop us a line in the comments if you want to be the first to hear when this goes live
Limited Time Offer For MDCS Followers
Shane is offering a free trial for Fetcher of up to two months! Firstly, if you sign up for Fetcher, you can earn a free trial by performing a few in-app tasks and then enjoy your 30-day trial. On top of that, for all of you MDCS fans we are offering an additional free month on top of that. Get your free trial here:
Get the free trial here: www.fetcher.com/million
If nothing else, you can get an insight into your business financials for the next two months – but I am pretty certain you are going to find the tool super useful and that it saves you tons of time. Good luck!
Next Up
Make sure you tune in for the next session for some exciting Jungle Slumber launch updates and a sneak peek at the product photography as well as some tips on scaling an Amazon business. We have a special guest, Alex Champagne, joining us from Empire Flippers to talk to us about scaling and selling an FBA business.
If you haven’t already registered, you can ensure you never miss out at junglescout.com/million.
Subscribe to our YouTube channel for the latest Amazon related content and videos:
One comment on “The Million Dollar Case Study: Europe – Session #17: Amazon Seller Analytics”