 65 Comments
Updated June 10th, 2019
Launching A Private Label Product on Amazon
Jungle Stix is a collaborative product launch case study that demonstrates how to launch a private label product on Amazon.
When I started this collaborative product launch with you guys, I wanted to share every aspect of launching and selling online with complete transparency. I fully anticipated it would include various challenges along the way.
Until now, however (can you hear me knocking on wood?), we have had good experiences with our supplier. But recently we started seeing an increase in competition, with new sellers joining the niche.
Bring. It. On!
What is the Jungle Stix case study?
Before we go any further, here is a high-level overview:
Jungle Stix: two months on Amazon.
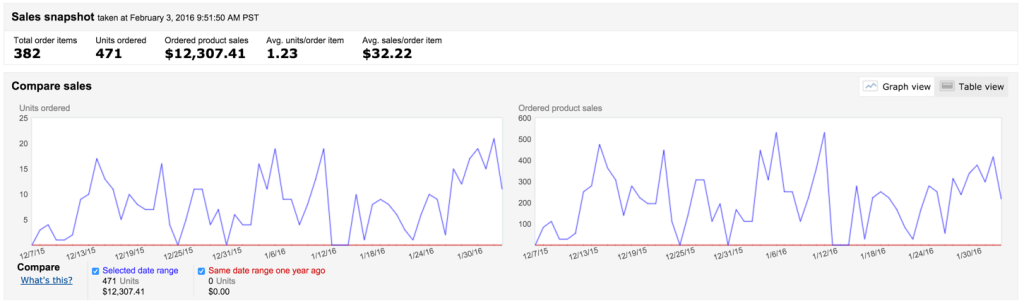
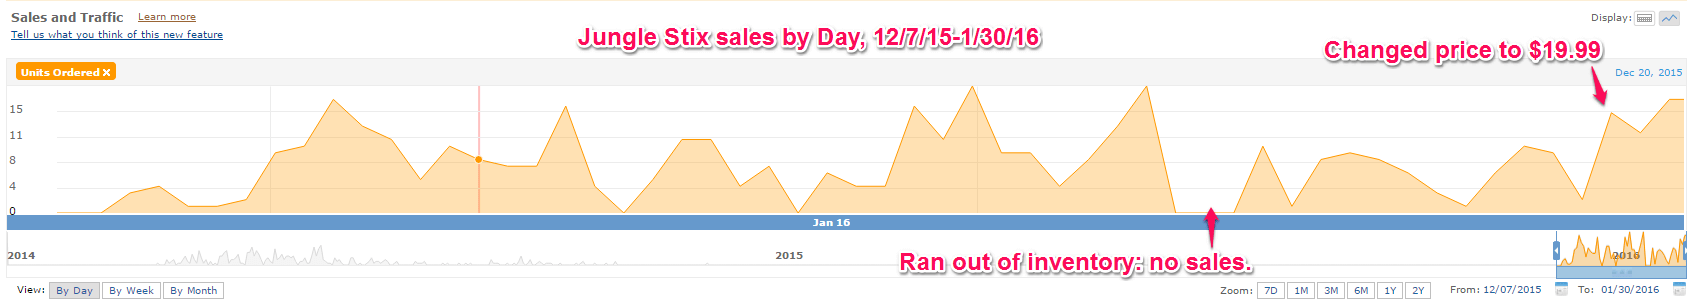
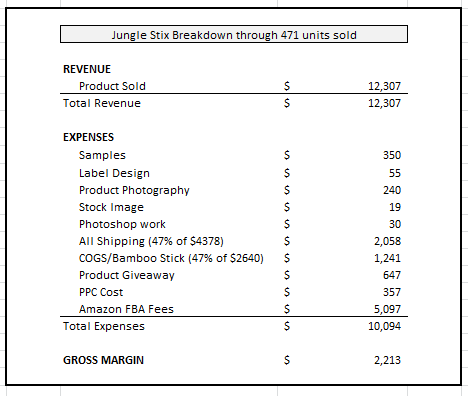
Our product went live on Amazon on December 7th, 2015. Since then, we have sold 471 units and $12,307 in sales in two months. Not bad! Regardless, we needed to figure out what it cost to achieve this figure in sales.
This is what our unit sales and revenue have been like:
Sales/revenue vs. gross margin: what’s more important?
People often get starry-eyed, seeing a handsome six-figure number for Amazon sales.
However, it’s the gross margin that is more relevant. Your gross margin is the amount of revenue you have left after you subtract direct costs such as ads, fees, and cost-of-goods sold.
My goal for any private label product I sell on Amazon is to hit a 100% Return on Investment (ROI). In other words, for every dollar I put into a product, I aim to get a dollar in profit.
What are fixed and upfront expenses?
First, let’s define fixed and upfront expenses.
Fixed expenses will be anything that does not change, no matter how many units are sold. For a typical business, this would include rent, salaries, insurance, etc. Fortunately, the beauty of the Fulfilled by Amazon’s business model means we don’t have many of these costs to deal with.
As for upfront expenses, those are charges we pay out-of-pocket when we accept an offer on products and services. In this case, we did have upfront costs in order to get our product, and listing, online.
The good news? We won’t have to pay any of these fees again:
Upfront expenses:
- Product Samples from five factories: $350
- Label Design: $55
- Product Photography: $40 x 6 = $240
- Stock Image (image of a boy by campfire and graphic of 6-foot tall man): $19
- Photoshop work for graphic images: $30
- Total Upfront Costs: $694
Note: We didn’t pay all of these costs. Thankfully, the Product Photography was donated to us by Robert House, and we were in China when receiving samples, so we got those for free as well. Not even a penny for shipping! Not to mention, our in house graphic designer did our label design.
That being said, I figured it would be much more helpful to include what it would normally cost, as opposed to free.
What are the variable costs?
Next, are our variable costs, or those that change depending on how many units we sell. In a typical business, a variable cost may be hourly wages, material or ingredient costs, fuel for your car, etc.
In our case, these variable costs include the cost of goods sold, shipping, Amazon fees, etc. And for our first 1000 units ordered, variable costs are as follows:
Shipping:
- $812 for 100 air express shipping (three days)
- $1499 for 200 air cargo (15 days)
- $1125 for 700 ocean freight all-inclusive, fees, customs
- $942 for Inbound Shipping to Amazon Warehouses from Port
- Total Shipping Costs: $4378
Note – For the second order, our total shipping will be under $2000. We chose to expedite the first order so we could start our case study sooner.
Cost of Goods Sold:
- Bamboo Sticks: $2640 for 1000 (includes polybag and label)
- Total Cost of Goods Sold: $2640
Promotions and Advertising:
- Product Giveaway Cost (50 units): $807.50
- Total Product Giveaway Cost: $807.50
What are product giveaways?
Product giveaways are the units we give to shoppers at a deeply discounted price. Sellers do it to generate sales momentum and, hopefully, positive reviews. It does come at a price though.
I calculated the “Product Giveaway” cost as $11.12 in Amazon Fees, based off a $27.99 retail price. Then I added the $7.02 cost per unit, minus the $1.99 that we “sold” it for on the Jump Send marketplace. This means we spent $16.15 for each unit we gave away.
Multiply that $16.15 by our 50 giveaways and we get the $807.50 I listed in our above-variable costs.
As for my giveaway limit, I don’t plan to do any more giveaways for our first order of 1,000 Jungle Stix. The 50 units we discounted produced the boost in sales velocity we were looking for, so doing more is unnecessary at this point.
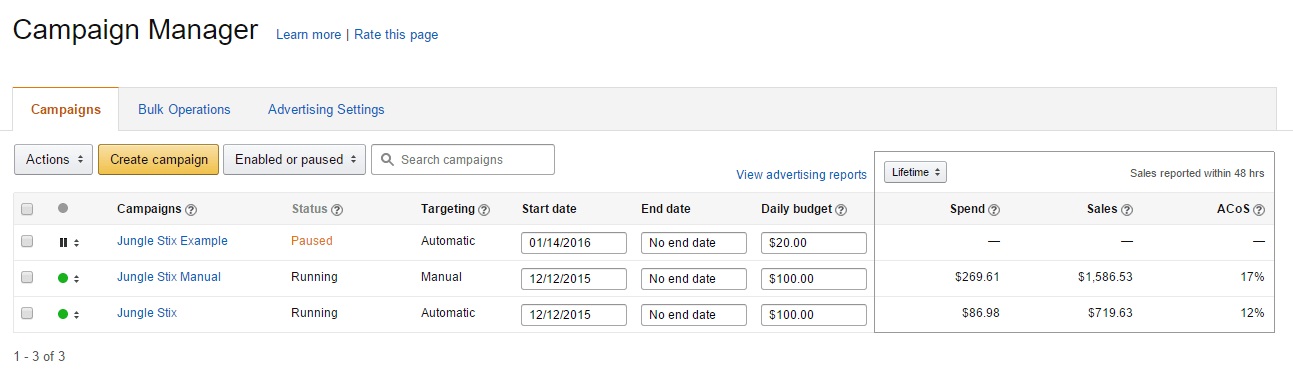
Pay Per Click Advertising Campaigns (PPC):
- Amazon PPC Advertising Costs: $357
- Total Advertising Cost: $357
Amazon FBA Fees:
The cost that we pay to Amazon per unit depends on our final retail price. I am currently experimenting with different price points to find the optimal price that maximizes profits. More on this later.
Here is how the FBA fees have looked thus far:
- Priced at $27.99, FBA Fees are: $11.12 for 354 units = $3936.48
- Priced at $19.99, FBA Fees are: $9.92 for 117 units = $1160.64
- Total FBA Fees (for 471 products): $5097.12
What are our total expenses?
Now, it’s just a matter of adding all of this up.
- Total Expenses: $13,973.62
Jungle Stix Revenue
Before we get discouraged with the laundry list of expenses, let’s take a look at our revenue.
The overall sales are a bit easier to calculate. We can simply take that from Amazon’s Seller Central Dashboard. From December 7th to February 3rd, we have accumulated $12,307 (which you can see in the Seller Central Dashboard screenshot earlier).
The sales trends per day are as follows:
- Total Revenue for (471 sales): $12,307
How do you calculate gross margin for an Amazon FBA product?
Our gross margin will simply be the difference between revenue and expenses, while net income, or profit, technically includes other operating expenses and taxes.
For simplicity’s sake, though, we’re just focusing on the gross margin.
What does all of this financial information mean?
Long-story-short: we are off to a great start! We’ve just about recovered all of our initial investment and we still have over 500 units to sell.
The gross margin analysis above combines upfront one-time expenses and promotional giveaway expenses, which I don’t plan to incur again. Variable costs will change according to the number of units that we sell.
Additionally, we paid a premium on our shipping for our first 1,000 units. The only reason we did that was to launch quickly, for this case study.
What if you save money by changing shipping methods?
So, how does the cost per unit change between the first order of 1000 and the second order of 1000, when we account for the different methods of importing?
As a reminder, the first 1000 units were a combination of air express (100 units), air cargo (200 units), and ocean freight (700 units), The second 1000 units are all being sent by ocean freight.
This is how the costs change between the two shipments:
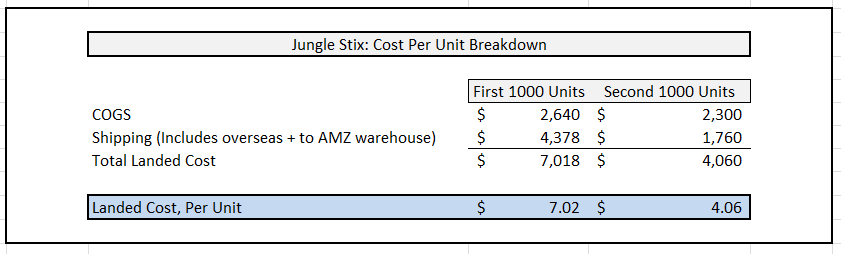
This reduction in cost will have significant ramifications on the profit margins, regardless of where we price the product.
To understand the long-term outlook on this, I like to look at the per-unit breakdown, as our costs are significantly lower for the second 1000 units after we incorporate a normalized shipping cost and amortize the upfront investment costs across more units.
So the $1341 we paid to get an optimized listing will now be spread over 2000 (or 3000 units), as opposed to 1000. And the final net margin we get per unit will be a combination of the retail price and the associated FBA fees.
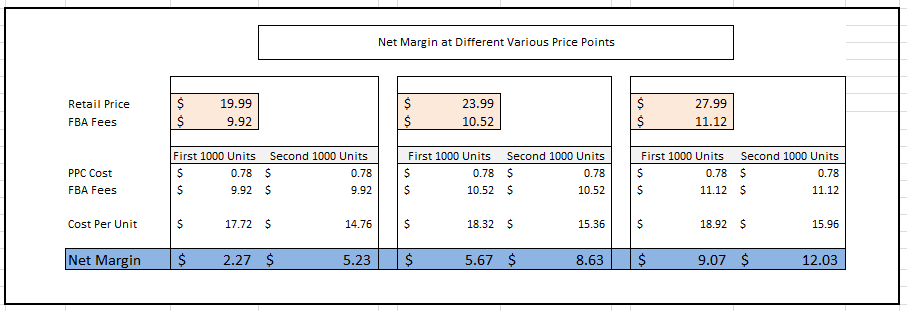
This is how it breaks down for various price points, and whether it is the first 1000 or second 1000 shipment:
My PPC Strategy
In my advertising spend projections, I like to spread the advertising spend in each unit sold, whether advertising contributed to the sale or not.
For example, we’ve sold 471 units so far, and have spent $357 on advertising. That means we’ve spent $357 in advertising for 471 units sold, or $0.76 per unit.
I plan to maintain this spend going forward and can adjust this figure if conversion rates or CPC costs change.
How did Jungle Stix come up with its pricing?
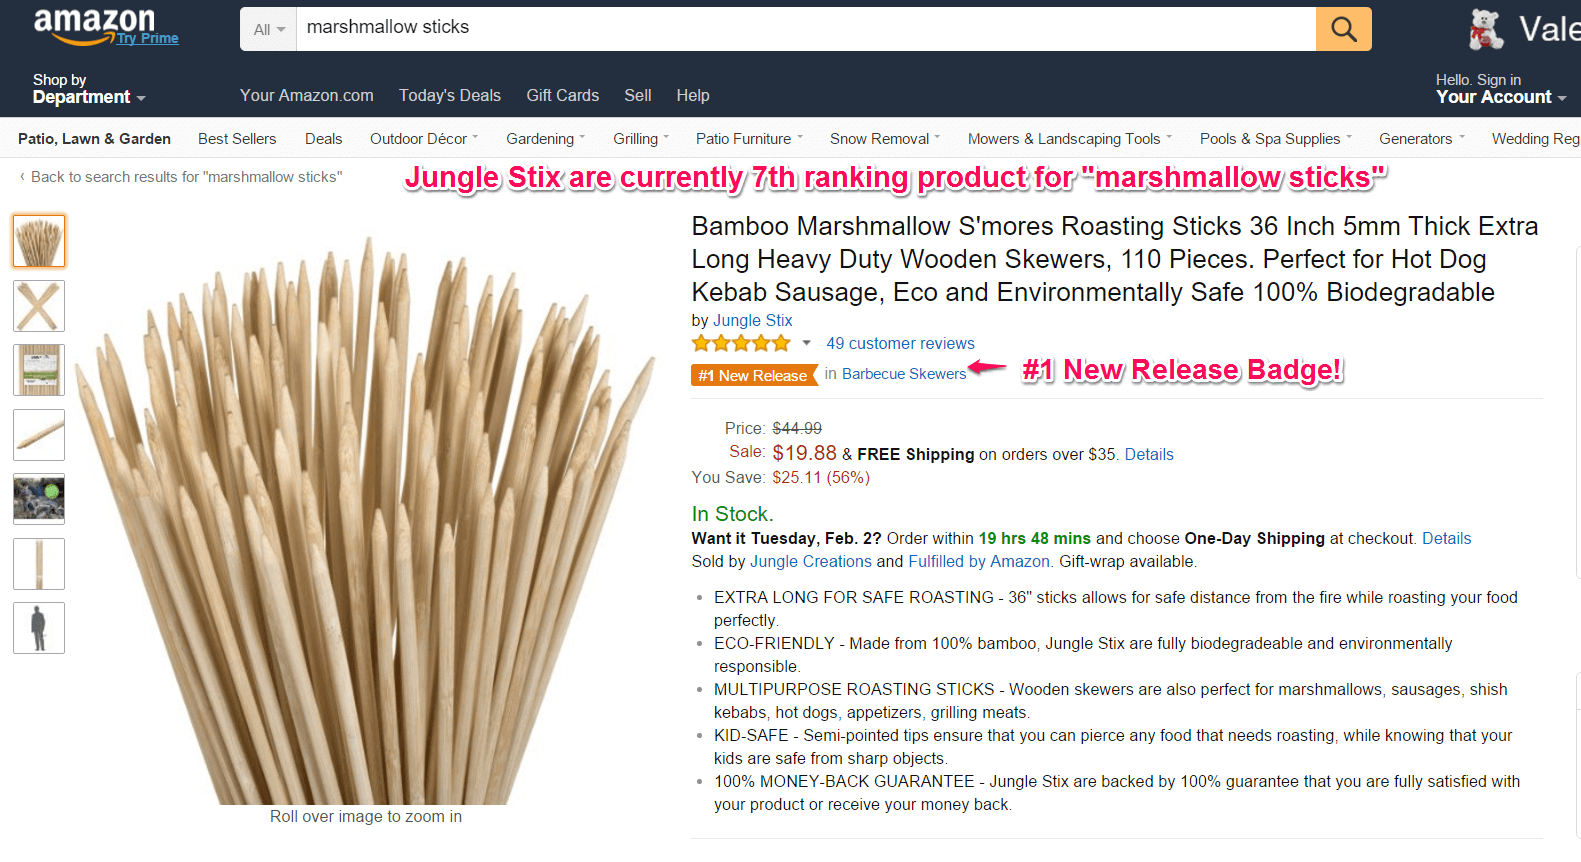
As I mentioned earlier, we have started to see some new entrants in the “bamboo marshmallow sticks” niche.
We expected that to happen and is the main reason most people do not share which products they are selling. If you tell someone exactly what product you’re selling and how much money you’re making, you’re bound to have copycats.
These competitors are selling their marshmallow sticks for $20, and even though they have fewer reviews, they’ve taken potential customers away from us with their competitive pricing.
We’re feeling the impact of this, and our average daily sales have decreased. We were selling about eight units per day before these competitors. That has since gone down to approximately five to six Jungle Stix per day, however.
That’s why, on January 26th, I changed the price to $19.99. I wanted to see how that would impact our sales and profits. Thankfully, by changing our price to $19.99, we have seen sales nearly triple to roughly 18 units each day.
But how would the new pricing structure change your profit margins?
My goal with experimenting with our price is to gauge how we sell at different price points, and to determine the optimal price for the Stix–one that generates a maximum net margin and sales velocity.
Based on current seasonality and competition, we can sell about eight units per day when priced at $27.99. We can sell 20 per day at $19.99. But if I split the difference at $23.99, I’m assuming we’ll sell an average of 14 per day.
Check out the pricing table below. This shows the trade-off between lower-priced and faster-selling items:
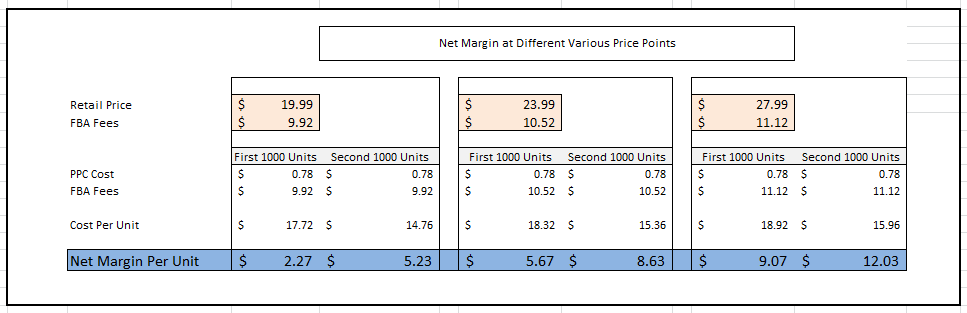
Looks like $23.99 might be the sweet spot for profits and sales velocity.
Are Jungle Stix a success?
Overall I think Jungle Stix are a success.
It’s certainly nice to see that, even at the very low price of $19.99, we can still make a profit of $5.23/unit. That gives us an ROI of 128%. And if I’m right about the pricing sweet spot, the $23.99 price I’m considering would mean a 213% ROI (roughly $3,000-4,000 PROFIT/month).
On another positive note, going into this we knew that January through March would be our slow time. We figured we would see increased momentum as summer and fall approached. So we’re very happy with the sales velocity we’ve seen so far.
Plus, as our Jungle Stix continue to sell, and we gather more reviews, we should see both an increased conversion rate (people more likely to buy a product with many reviews), as well as an improved organic ranking for various keywords (we are currently on the front page for our main targeted keyword: marshmallow sticks).
What happens when you run out of products?
In early January, we ran out of inventory.
Our ocean freight shipment was held up at customs in Hong Kong for a few days. It also experienced delays in the States upon arrival. SO frustrating, and far from ideal.
However, I often see comments online about how this can be a momentum killer and plummet your hard-earned Best Seller Rank. And though this may be true, the negative consequences of running out of stock will depend on the strength of the listing and the competitiveness of category.
With Jungle Stix, I did what I could to mitigate any problems, which was to turn off our paid campaigns and discontinue any promotions.
There were three days of flat-lined sales (while we were out of stock), as you can see from the dashboard screenshot. But but did it really hurt our BSR?
True, there was a spike in BSR while the product was out of stock (and Amazon automatically removed the product from search results). You can see from the chart below, though, that the BSR recovered within a few days:
![]()
So what’s next?
Well, as I mentioned earlier, we’ve ordered another 1000 units. They’ll be manufactured and shipped via ocean freight.
Ideally, I would like to exceed our baseline goal of 10 units per day. Can we can push that sales number to 20 per day, as we have been doing while priced at $19.99?
I’m also going to keep an eye on the competition to see how they price as we move towards the summer months.
Like I’ve said before, I’m not keen on selling products on Amazon that become a race-to-the-bottom for the price. There are never any winners in that situation!
So stay tuned to see how this plays out, and please share any comments below.
65 comments on “Selling Private Label Products on Amazon | Jungle Stix Update”