 1 Comment


See how consumer shopping behavior is changing over time with insights from Jungle Scout’s Q2 2021 Consumer Trends Report.
This report answers the following questions:
- What kinds of products are consumers currently buying?
- What product categories gained the most traction in 2021?
- Where are consumers prioritizing their spending in 2021?
Insights will be updated quarterly, check back for the most recent data.
Top product categories in 2021
Overall, consumers are buying more groceries, cleaning supplies, and vitamins, while buying less clothing, electronics, and office supplies.
| Product Category | Consumers buying more | Consumers buying the same amount | Consumers buying less | Consumers who never buy in this category |
| Automotive Parts & Accessories | 15% | 43% | 20% | 22% |
| Electronics (TVs, smart watches, etc.) | 19% | 46% | 23% | 12% |
| Groceries | 37% | 53% | 8% | 2% |
| Arts, Crafts & Sewing (paints, ceramics, etc.) | 24% | 30% | 19% | 27% |
| Home & Kitchen (furniture, coffee makers, etc.) | 21% | 46% | 20% | 14% |
| Office supplies (laptop stands, printer paper, etc.) | 20% | 43% | 20% | 17% |
| Pet supplies (cat/dog food, toys, etc.) | 21% | 46% | 7% | 26% |
| Books (print or digital), Magazines & Newspapers | 24% | 42% | 17% | 17% |
| Clothing | 24% | 45% | 27% | 4% |
| Beauty & Personal Care (cosmetics, shaving kit, etc.) | 24% | 53% | 16% | 7% |
| Toys & Games (board games, children’s toys, etc.) | 21% | 34% | 16% | 29% |
| Garden & Outdoor (patio furniture, plants, etc.) | 22% | 39% | 19% | 21% |
| Exercise/Fitness supplies (at-home gym equipment, etc.) | 22% | 31% | 15% | 33% |
| Over-the-counter medicine | 20% | 58% | 13% | 8% |
| Cleaning supplies | 35% | 53% | 8% | 4% |
| Alcohol | 20% | 36% | 17% | 28% |
| Vitamins & Dietary Supplements | 27% | 52% | 11% | 11% |
| Tobacco, Pipes & Accessories | 16% | 26% | 12% | 46% |
While essential items are still key, individuals are spending more on products that make them feel good and support their hobbies. Nearly 1 in 4 consumers are spending more on beauty and personal care, and 21% are spending more on toys and games.
Compared to last quarter, consumers have made more purchases in the following categories:
- Garden & Outdoor – up 83%
- Office Supplies – up 33%
- Automotive Parts & Accessories – up 25%
- Exercise & Fitness – up 24%
In general, consumers are buying less alcohol — purchases in this category are down 6% since last quarter.
In addition to new products, consumers are interested in buying and selling pre-owned items. Nearly a third (32%) say they are looking for pre-owned products when they shop online, and 44% of consumers have bought or sold a pre-owned item online over the last 12 months.
The most popular pre-owned items include clothing, books, and electronics.
| Pre-owned products purchased | U.S. consumers |
| Clothing | 41% |
| Books | 33% |
| Electronics | 30% |
| Furniture | 24% |
| Jewelry | 23% |
| Sporting goods | 22% |
| Watches | 22% |
| Tools and Home Care | 21% |
| Exercise Equipment | 20% |
| Bikes | 16% |
| Musical Instruments | 14% |
| Cars | 13% |
| Other | 9% |
Consumer focus areas for 2021
In 2021, consumers are prioritizing family, physical and mental health, and finances.
| Focus area | U.S. consumers |
| Family | 65% |
| Physical health and well-being | 48% |
| Mental health and well-being | 42% |
| Finances | 39% |
| Friends | 37% |
| Pets | 36% |
| Hobbies and interests | 34% |
| Spirituality | 27% |
| Spending time outside | 27% |
| Love life | 26% |
| Career | 25% |
| Politics/Civic engagement | 18% |
| Education | 17% |
| Travel | 14% |
| Other | 1% |
Which priorities changed the most since last quarter?
Consumers are showing renewed interest in travel (up 41%) and socializing (up 23%), while focusing less on politics ( down 8%). While health remains a main focus area for many consumers, data indicates it’s a less pressing concern a year after the COVID-19 pandemic began.
How consumer focus areas have shifted since Q1 2021:
- Travel – up 41%
- Education – up 34%
- Friends – up 23%
- Mental health and well-being – down 14%
- Physical health and well-being – down 8%
- Politics and civic engagement – down 8%
People are eager to resume public, pre-pandemic activities like dining indoors, attending weddings and in-person sporting events, and getting beauty treatments at salons. Many already feel comfortable traveling and sharing indoor spaces with others, which could inform what they shop for in Q2 and beyond.
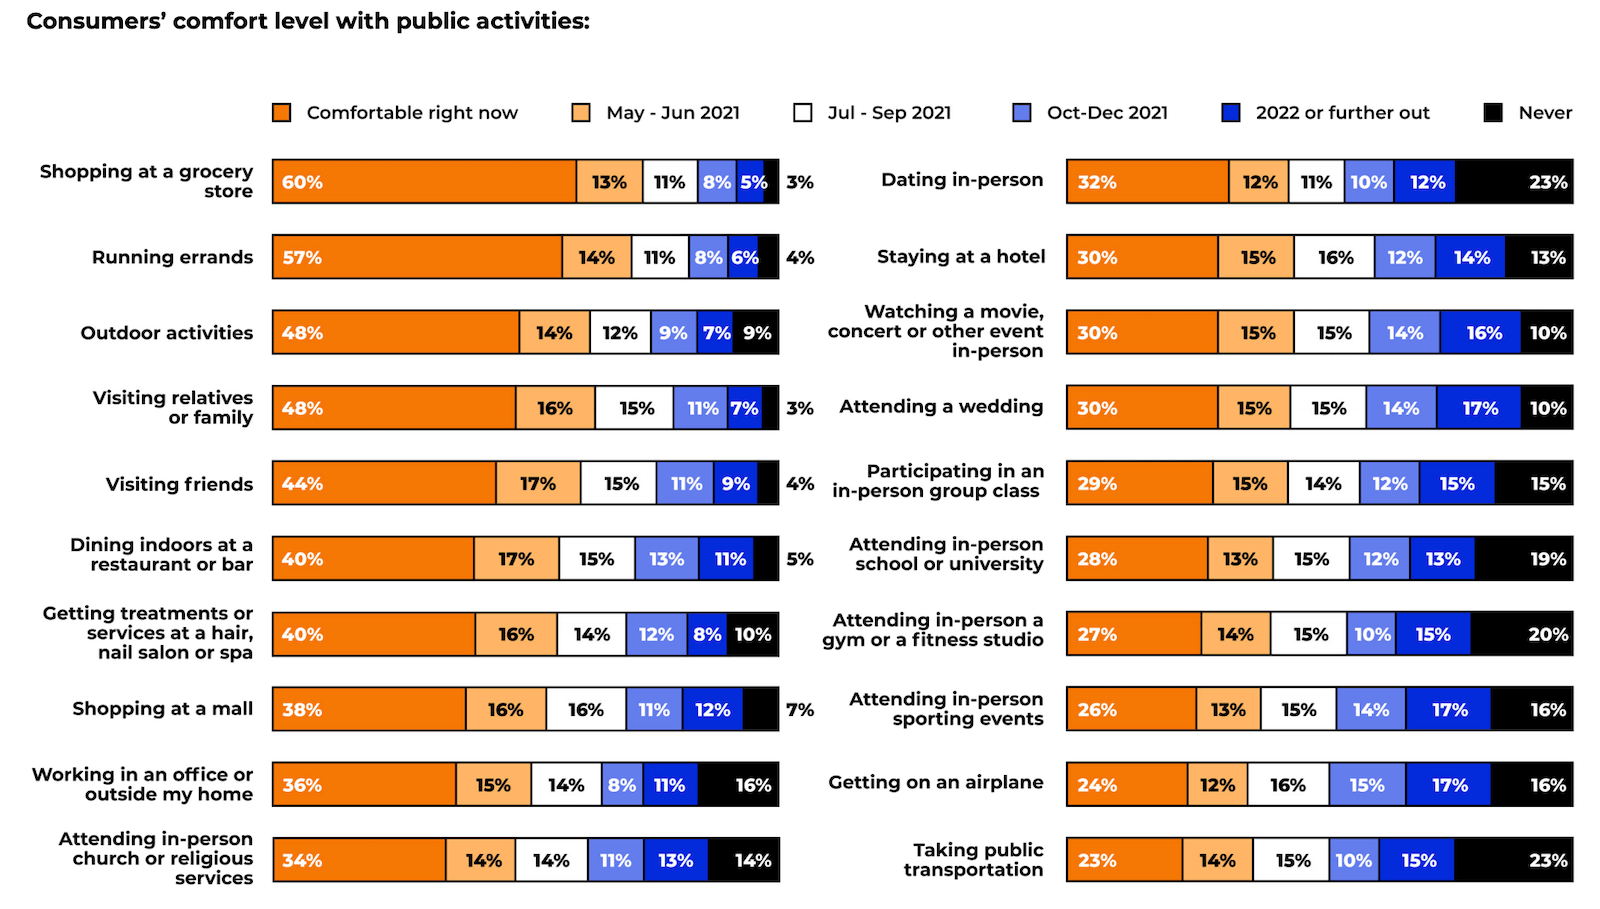
In addition, some consumers plan to stop certain socially-distanced activities, like exercising, working, and cooking at home, in the next 12 months. Accordingly, we could see increased purchases in product categories related to work commutes, travel, and attending events in-person.
| Activity | Consumers doing more of this in last 12 months | Consumers planning to continue this in next 12 months | Percent of consumers planning to drop activity |
| Watching movies/TV | 55% | 42% | 13% |
| Cooking at home | 50% | 38% | 12% |
| Cleaning | 44% | 31% | 13% |
| Purchasing goods online | 39% | 26% | 13% |
| Making coffee at home | 37% | 27% | 10% |
| Reading | 36% | 27% | 9% |
| Video calls with family or friends | 35% | 24% | 11% |
| Exercising at home | 35% | 28% | 7% |
| Sleeping more | 34% | 20% | 14% |
| Eating healthy | 34% | 29% | 5% |
| Purchasing groceries online | 30% | 22% | 8% |
| Working from home | 27% | 19% | 8% |
| Home improvement projects | 23% | 16% | 7% |
| DIY activities | 20% | 14% | 6% |
| Starting/running a business | 10% | 7% | 3% |
For more insights about how consumers spend in general and online, check out Jungle Scout’s latest Consumer Trends Report.