
 No Comments


U.S. consumers use Japanese products every day, and top Japanese brands—like Toyota, Sony, and Toshiba—are ubiquitous. Businesses in Japan don’t just design some of the most-loved products in the U.S.—according to the 2020 Global Imports Report, they also manufacture many of the goods imported by the U.S. each year.
How has Japan’s trade with the U.S. changed over time, what are the U.S.’s most-sourced products from Japan, and how might U.S. imports from Japan look different in the future? Let’s explore the data.
Japan’s global trade performance over time
This analysis concerns data on imports that are shipped to the U.S. by boat. Japan and other global trade partners to the U.S. transport goods by other means—including road, rail, or air—which affect the total number of imports in a given year. Nonetheless, maritime import data offer valuable insights into trade relationships with the U.S.—past, present, and future.
Japan has held a steady presence among the U.S.’s top ten maritime importers since 2015.
![]()
It typically contributes roughly 3% of U.S. imports, though its share has contracted in recent years as China, Vietnam, and other U.S. trade partners have increased theirs. In the first half of 2020, the U.S. had sourced 2.6% of its imports from Japan, equating to around 147,510 imports.
Within Asia, Japan is also consistently among the largest importers to the U.S. Notably, China leads the region (and the rest of the world) by a significant gap.
Top 10 U.S. Importers in Asia | 2020
Country
Number of Imports to the U.S.
Share of U.S. Imports
China
2,332,189
41.1%
Vietnam
311,186
5.5%
Taiwan
209,839
3.7%
India
204,238
3.6%
South Korea
188,300
3.3%
Japan
144,776
2.6%
Thailand
109,811
1.9%
Hong Kong
91,888
1.6%
Indonesia
89,045
1.6%
Malaysia
61,454
1.1%
What kinds of products does the U.S. import from Japan?
U.S. imports from Japan predominantly fall into five major categories: machinery, metals, chemicals, transportation, and plastics or rubber. Other items, like food, fabric, and lumber, make up smaller portions of Japan’s overall import profile.
U.S. Imports from Japan by Category | 2020
Category
Number of Imports
Percent of U.S. Imports from Japan
Machinery / Electrical
40,188
28.8%
Metals
16,576
11.9%
Chemicals & Allied Industries
15,140
10.8%
Transportation
14,698
10.5%
Plastics / Rubbers
14,616
10.5%
Miscellaneous
10,917
7.8%
Foodstuffs
6,307
4.5%
Textiles
6,107
4.4%
Wood & Wood Products
4761
3.4%
Stone / Glass
3,622
2.6%
Vegetable Products
3160
2.3%
Mineral Products
2,088
1.5%
Animal & Animal Products
919
0.7%
Footwear / Headgear
322
0.2%
Raw Hides, Skins, Leather, & Furs
212
0.2%
Using Jungle Scout’s Supplier Database, we can identify which items sold in the U.S. Amazon marketplace are sourced from Japan. Here are some examples of top-performing Japanese products, listed by import category.
1. Machinery & Electrical
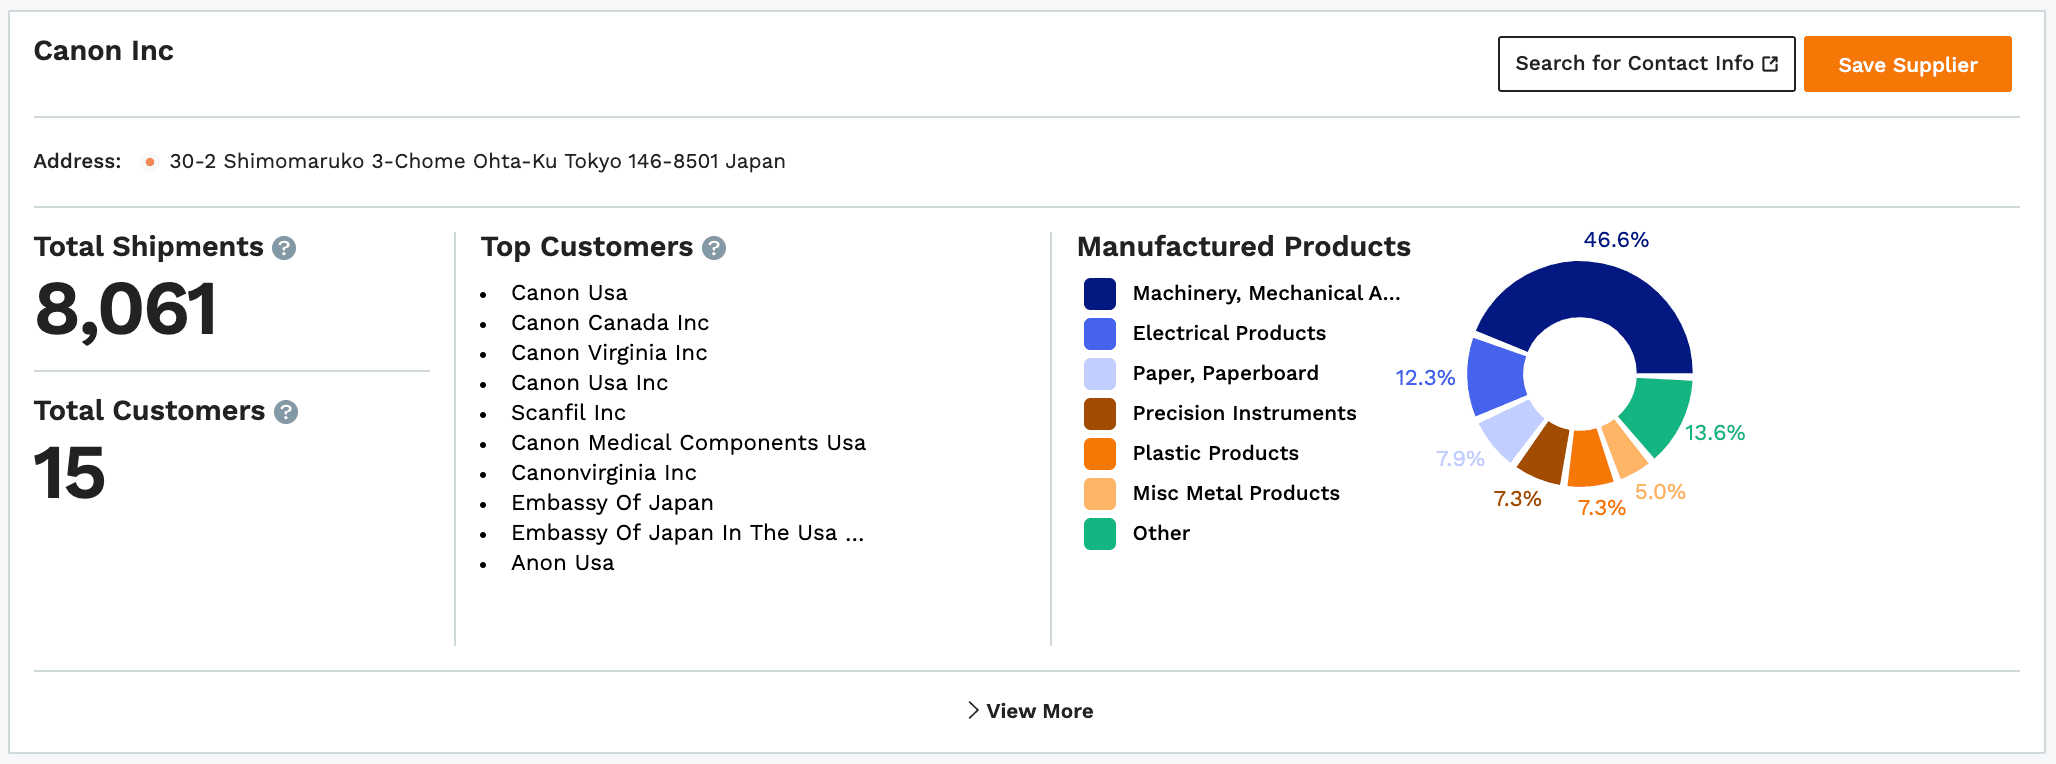
Roughly 29% of U.S. imports from Japan are categorized as machinery or electronics. U.S. consumers rely on goods from Japanese brands like Mitsubishi, Nintendo, and Yamaha to power their everyday lives. They also turn to Japanese products to capture special occasions: many of the top-performing camera companies in the world are headquartered in Japan. Among these are Nikon, Olympus, and Canon.

Canon manufactures its digital cameras in Tokyo.
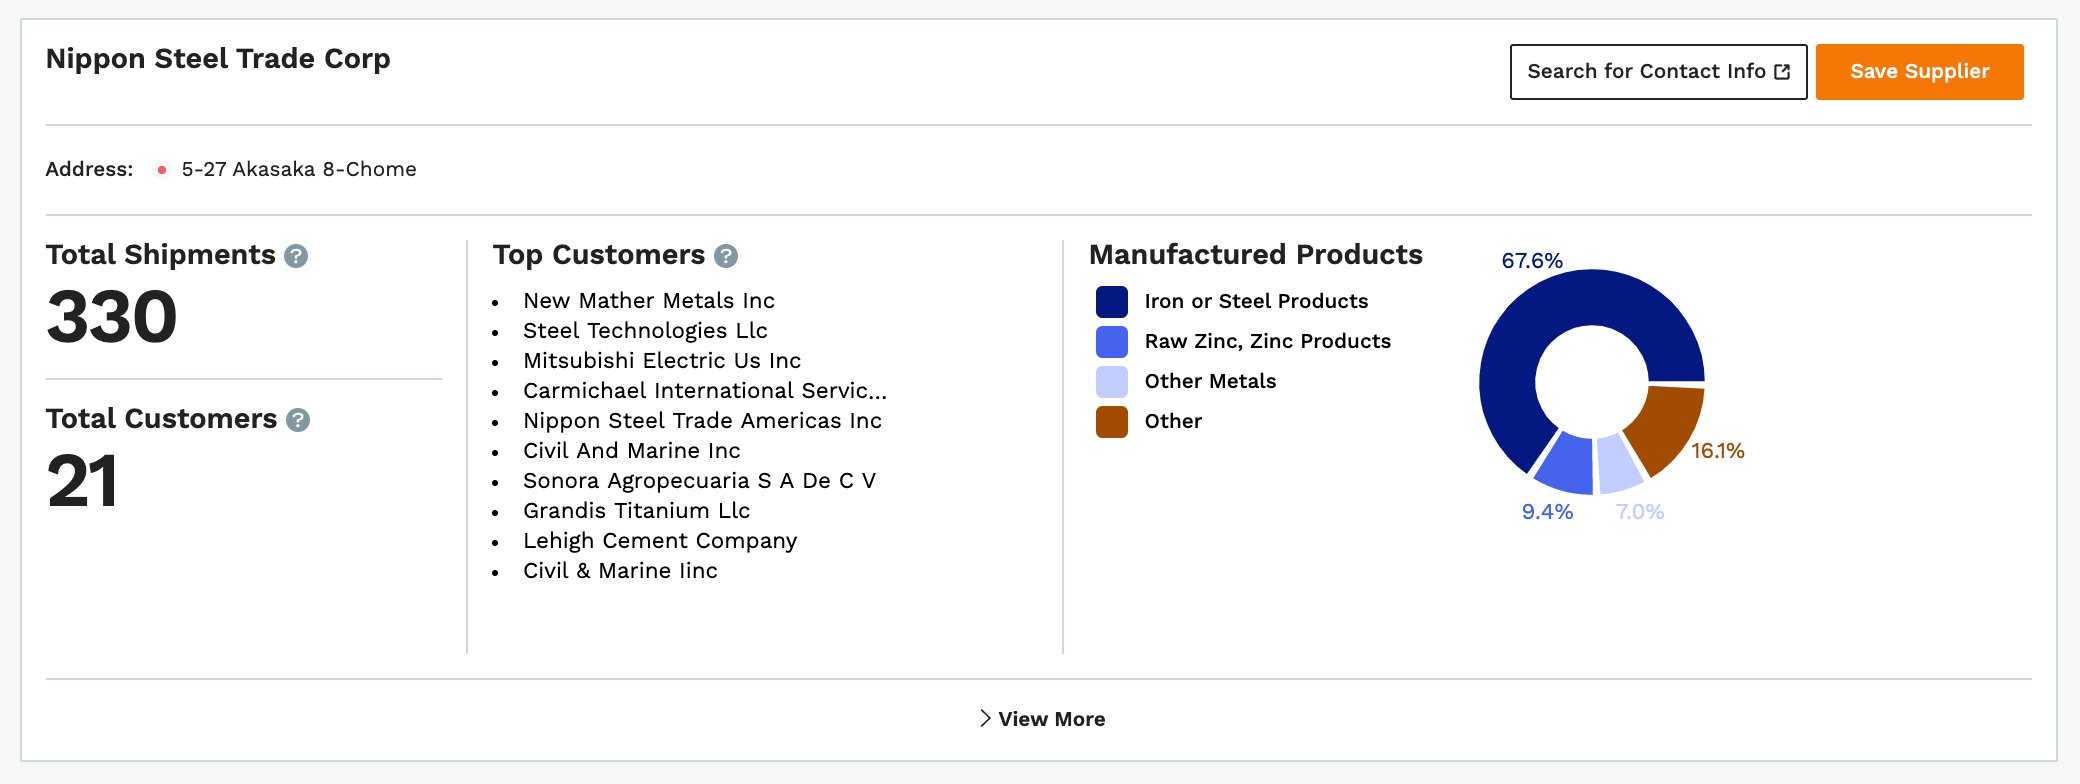
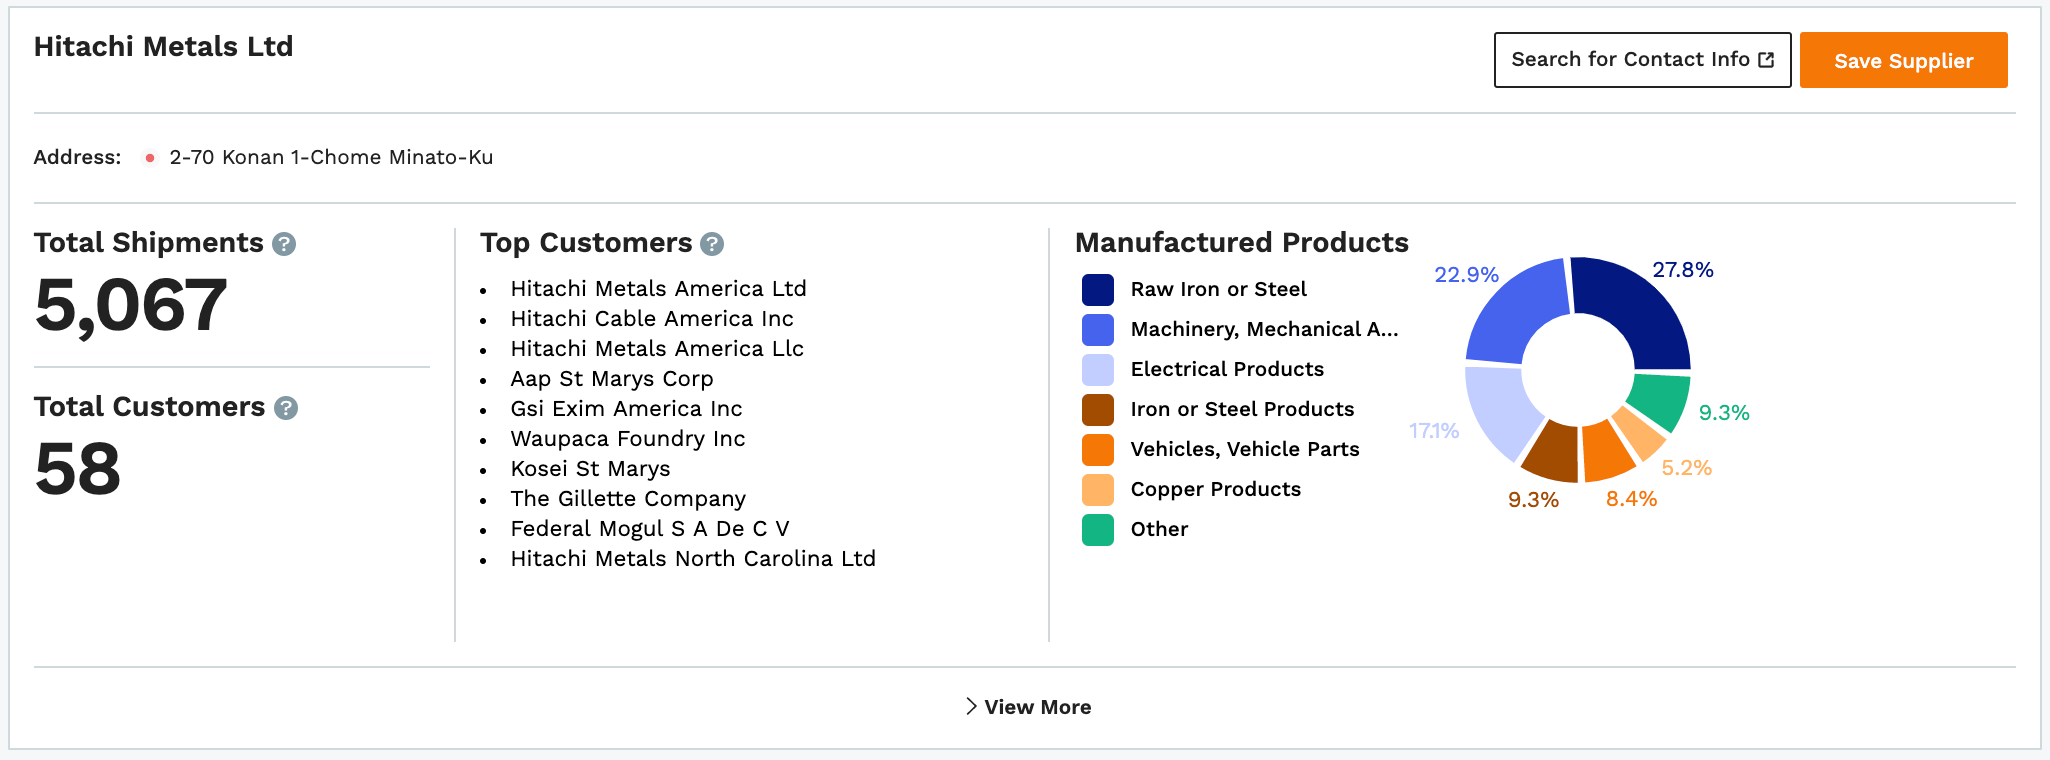
2. Metals
About 12% of U.S. imports from Japan are classified as metals. Japan is particularly known for its high-quality steel, which can be found in Amazon items such as kitchen knives and hairdressing shears. Many of the top Japanese steel producers supply products to top brands like Mitsubishi and Gillette.
3. Chemicals & Allied Industries
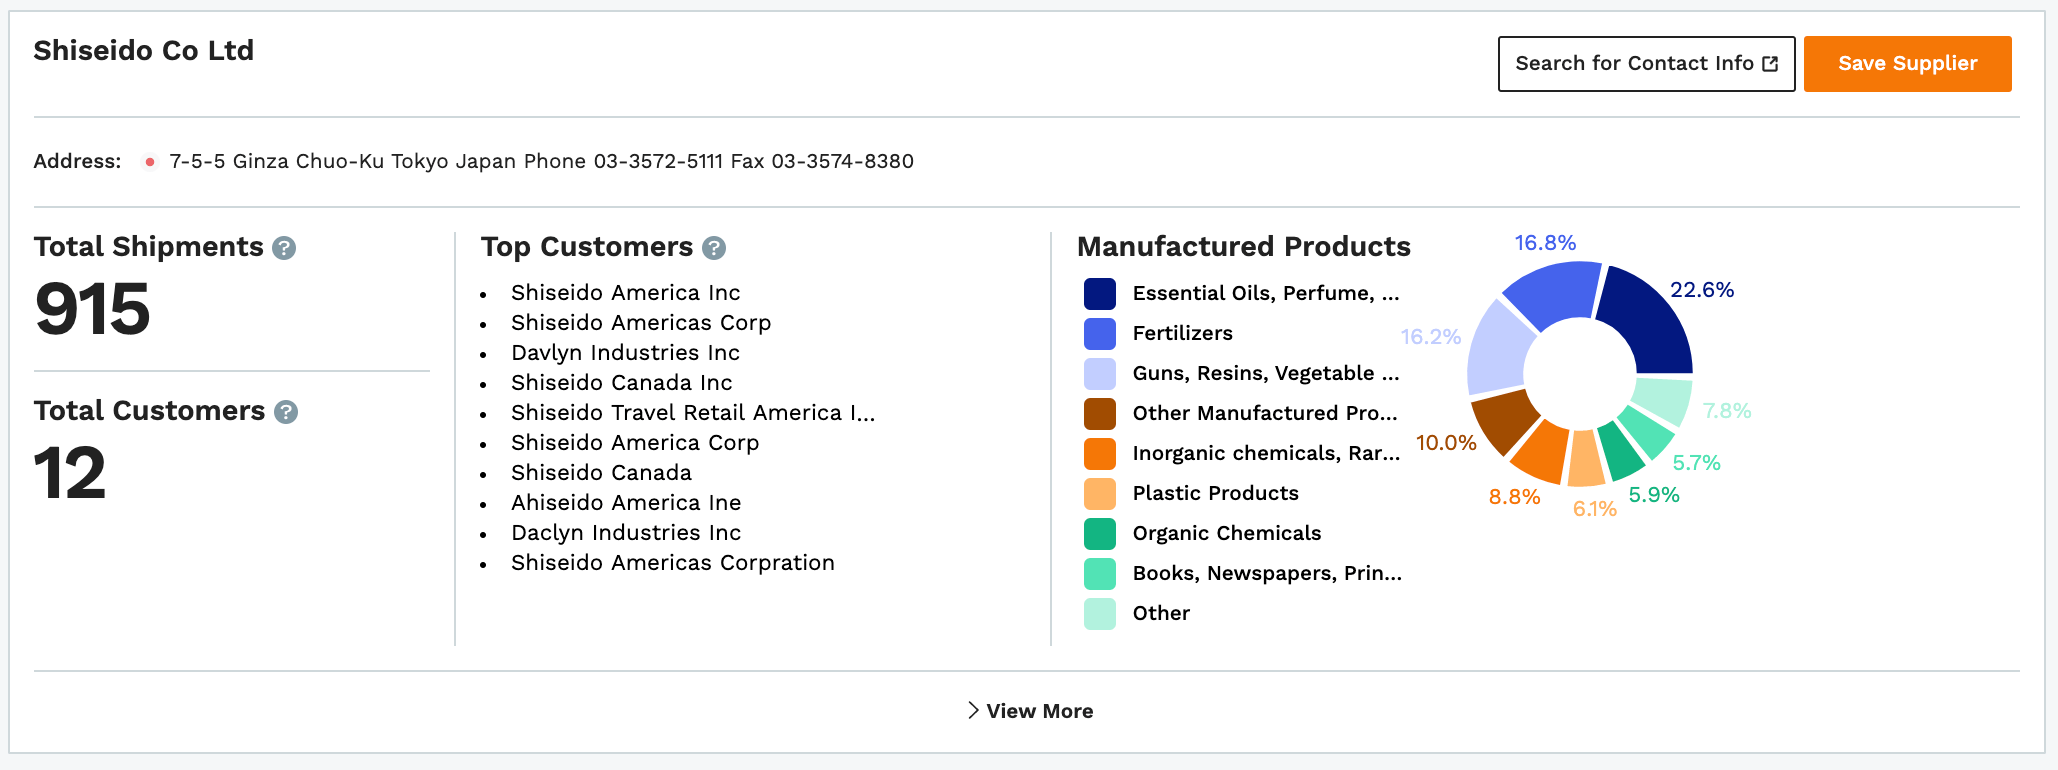
Just over a tenth (11%) of U.S. imports from Japan are chemicals or related products. This includes cosmetics and pharmaceutical items. Tokyo-based luxury skincare brand Shiseido is an example.

Shiseido manufactures its moisturizers, sunscreens, and topical serums in Tokyo and sells them on Amazon.
Predicting the future of U.S. Imports from Japan
Given the trade growth between the U.S. and other countries with significant machinery, metals, and chemicals industries, Japan’s future share of U.S. imports may depend in part on its ability to recover quickly from disruptions to the global supply chain like the COVID-19 pandemic.
Japan was among the hardest-hit countries in terms of U.S. import share during the COVID-19 pandemic. Similarly to India, Italy, Germany, and the U.K., Japan’s year-over-year import volume to the U.S. took a plunge in January 2020 that steadily worsened throughout the first half of the year as coronavirus spread across the globe. By the end of June 2020, total U.S. imports from Japan had been reduced by 20% year-over-year.
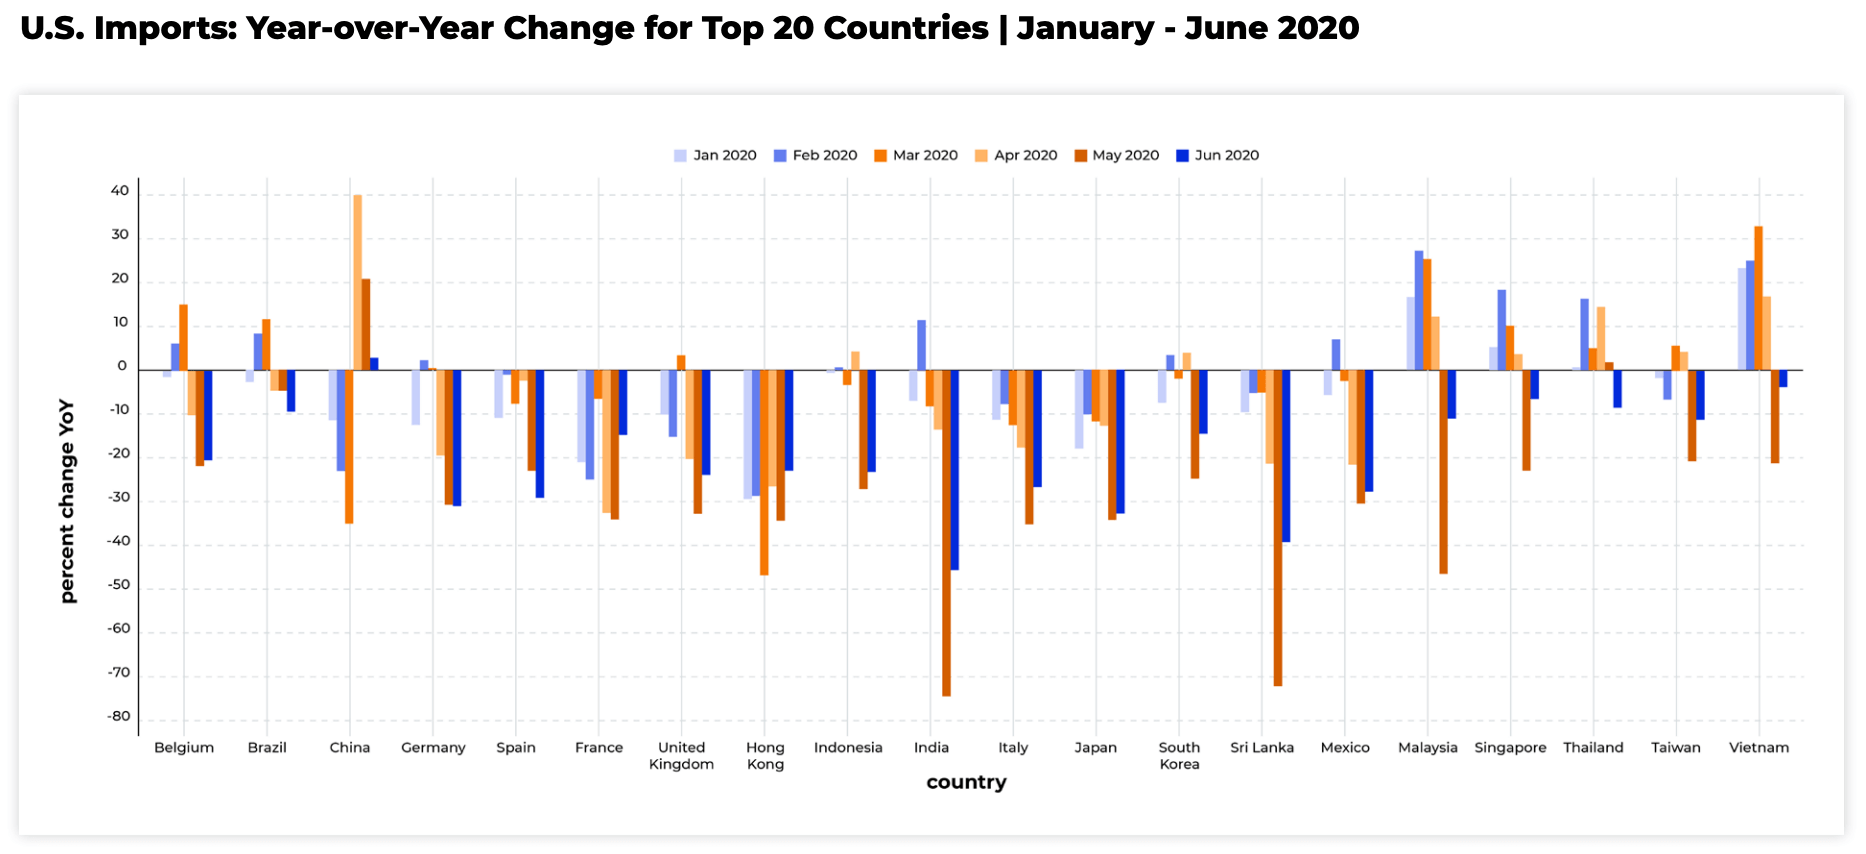
While a significant decrease for the region (several other Asian countries like China, Vietnam, and Thailand were able to “bounce back” and achieve year-over-year growth in their H1 U.S. imports in June), Japan’s decline was not as severe as Hong Kong’s 31% drop or India’s 24% reduction. As July approached U.S. imports from Japan had begun to increase.
Japan is home to many of the top global brands, and the U.S. is unlikely to stop importing Japanese products that have long been American household staples. Based on its historical trade data, COVID-19 recovery, and its brands’ popularity among U.S. consumers, Japan is likely to continue to contribute a sizable share of U.S. imports for years to come.